

Question: 6 . 3 3 * Figure P . 6 . 3 3 shows the image irradiance distributions arising when a monochromatic point source illuminates three
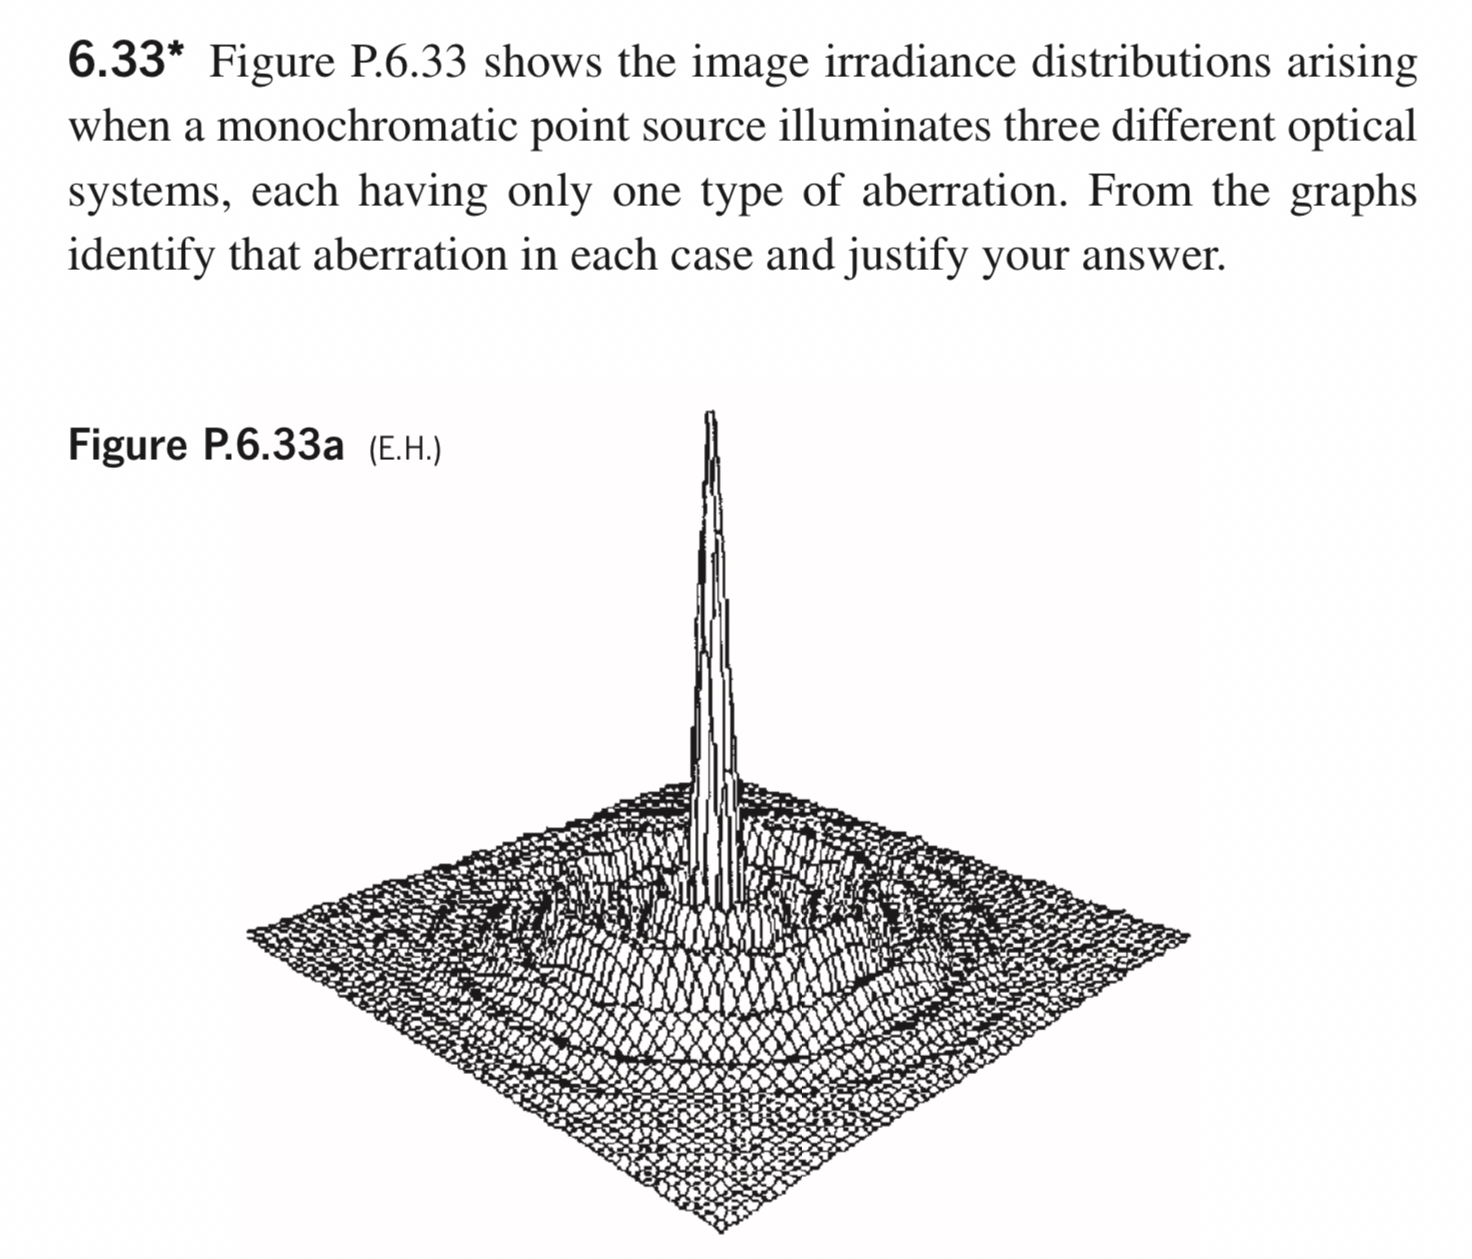
Figure P shows the image irradiance distributions arising when a monochromatic point source illuminates three different optical systems, each having only one type of aberration. From the graphs identify that aberration in each case and justify your answer.
Figure Pa EH
Step by Step Solution
There are 3 Steps involved in it
1 Expert Approved Answer
Step: 1 Unlock

Question Has Been Solved by an Expert!
Get step-by-step solutions from verified subject matter experts
Step: 2 Unlock
Step: 3 Unlock