

Question: 6 . 4 . 2 Implementing a Dynamic Visualization The script we present in this section uses the same Seaborn and Matplotlib features shown in
Implementing a Dynamic Visualization
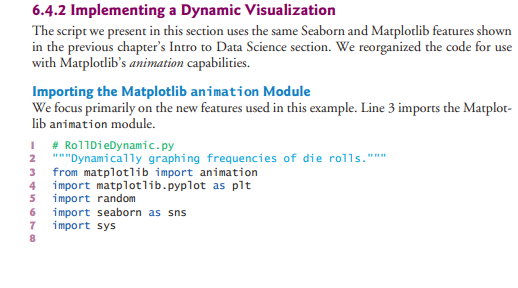
The script we present in this section uses the same Seaborn and Matplotlib features shown
in the previous chapter's Intro to Data Science section. We reorganized the code for use
with Matplotlib's animation capabilities.
Importing the Matplotlib animation Module
We focus primarily on the new features used in this example. Line imports the Matplot
lib animation module.
#
RoDieDynamic.py
Dynamicay graphing frequencies of die rolls.""n
from matplotlib import animation
import matplotibpyplot as pt
import random
import seaborn as sns
import sys
Step by Step Solution
There are 3 Steps involved in it
1 Expert Approved Answer
Step: 1 Unlock

Question Has Been Solved by an Expert!
Get step-by-step solutions from verified subject matter experts
Step: 2 Unlock
Step: 3 Unlock