

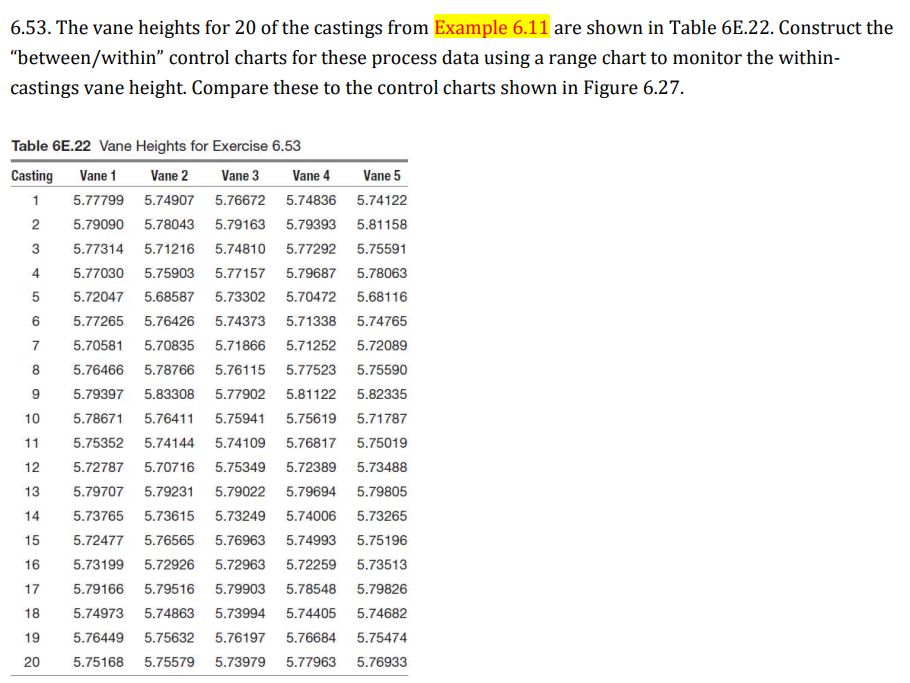
Question: 6 . 5 3 . The vane heights for 2 0 of the castings from Example 6 . 1 1 are shown in Table 6
The vane heights for of the castings from Example are shown in Table E Construct the
"betweenwithin control charts for these process data using a range chart to monitor the within
castings vane height. Compare these to the control charts shown in Figure
Table E Vane Heights for Exercise
Step by Step Solution
There are 3 Steps involved in it
1 Expert Approved Answer
Step: 1 Unlock

Question Has Been Solved by an Expert!
Get step-by-step solutions from verified subject matter experts
Step: 2 Unlock
Step: 3 Unlock