

Question: * & % 6 8 9 5 P E R K D G H S pause M X C B N only includes those 214
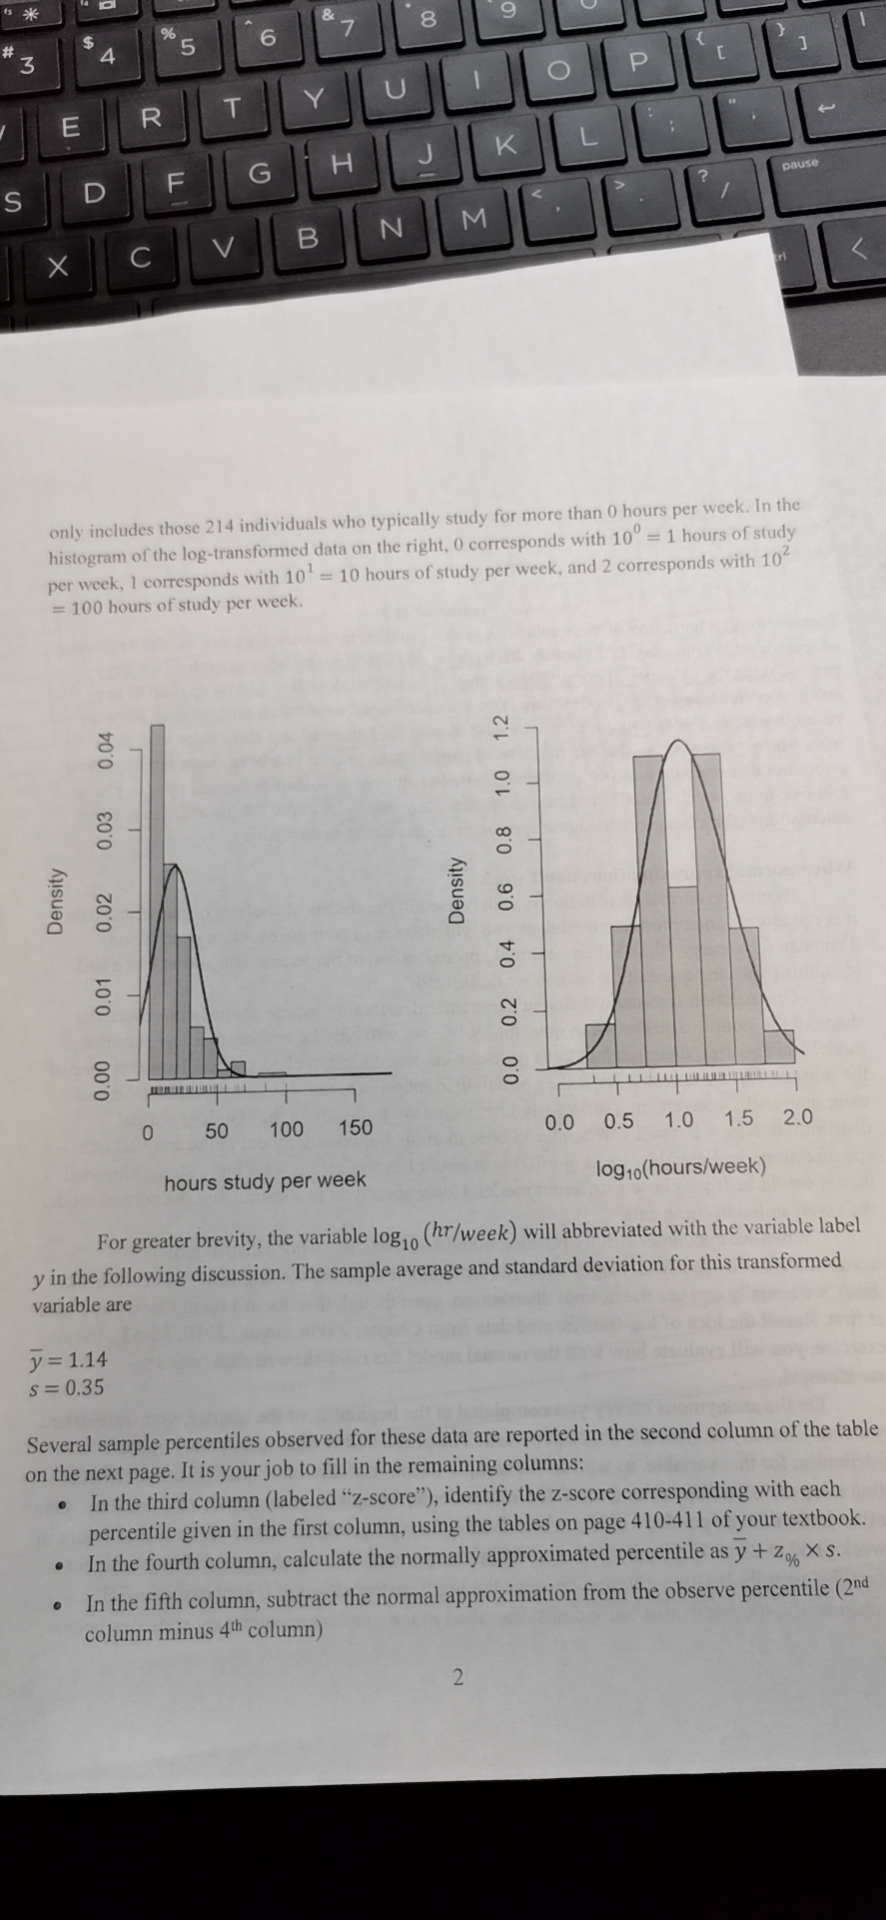
* & % 6 8 9 5 P E R K D G H S pause M X C B N only includes those 214 individuals who typically study for more than 0 hours per week. In the histogram of the log-transformed data on the right, 0 corresponds with 10" = 1 hours of study per week, 1 corresponds with 10 = 10 hours of study per week, and 2 corresponds with 102 = 100 hours of study per week. Density 0.02 0.03 0.04 Density 0.00 0.01 0.0 0.2 0.4 0.6 0.8 1.0 1.2 0 50 100 150 0.0 0.5 1.0 1.5 2.0 hours study per week log 10(hours/week) For greater brevity, the variable log1 (hr/week) will abbreviated with the variable label y in the following discussion. The sample average and standard deviation for this transformed variable are y = 1.14 S = 0.35 Several sample percentiles observed for these data are reported in the second column of the table on the next page. It is your job to fill in the remaining columns: . In the third column (labeled "z-score"), identify the z-score corresponding with each percentile given in the first column, using the tables on page 410-411 of your textbook. . In the fourth column, calculate the normally approximated percentile as y + Zy XS. . In the fifth column, subtract the normal approximation from the observe percentile (2nd column minus 4th column) N
Step by Step Solution
There are 3 Steps involved in it

Get step-by-step solutions from verified subject matter experts