

Question: 6. a.) Construct the cost schedule using the data below for a firm operating in the short run. b.) Graph the average variable cost, average
6. a.) Construct the cost schedule using the data below for a firm operating in the short run.
b.) Graph the average variable cost, average total cost, and marginal cost curves.
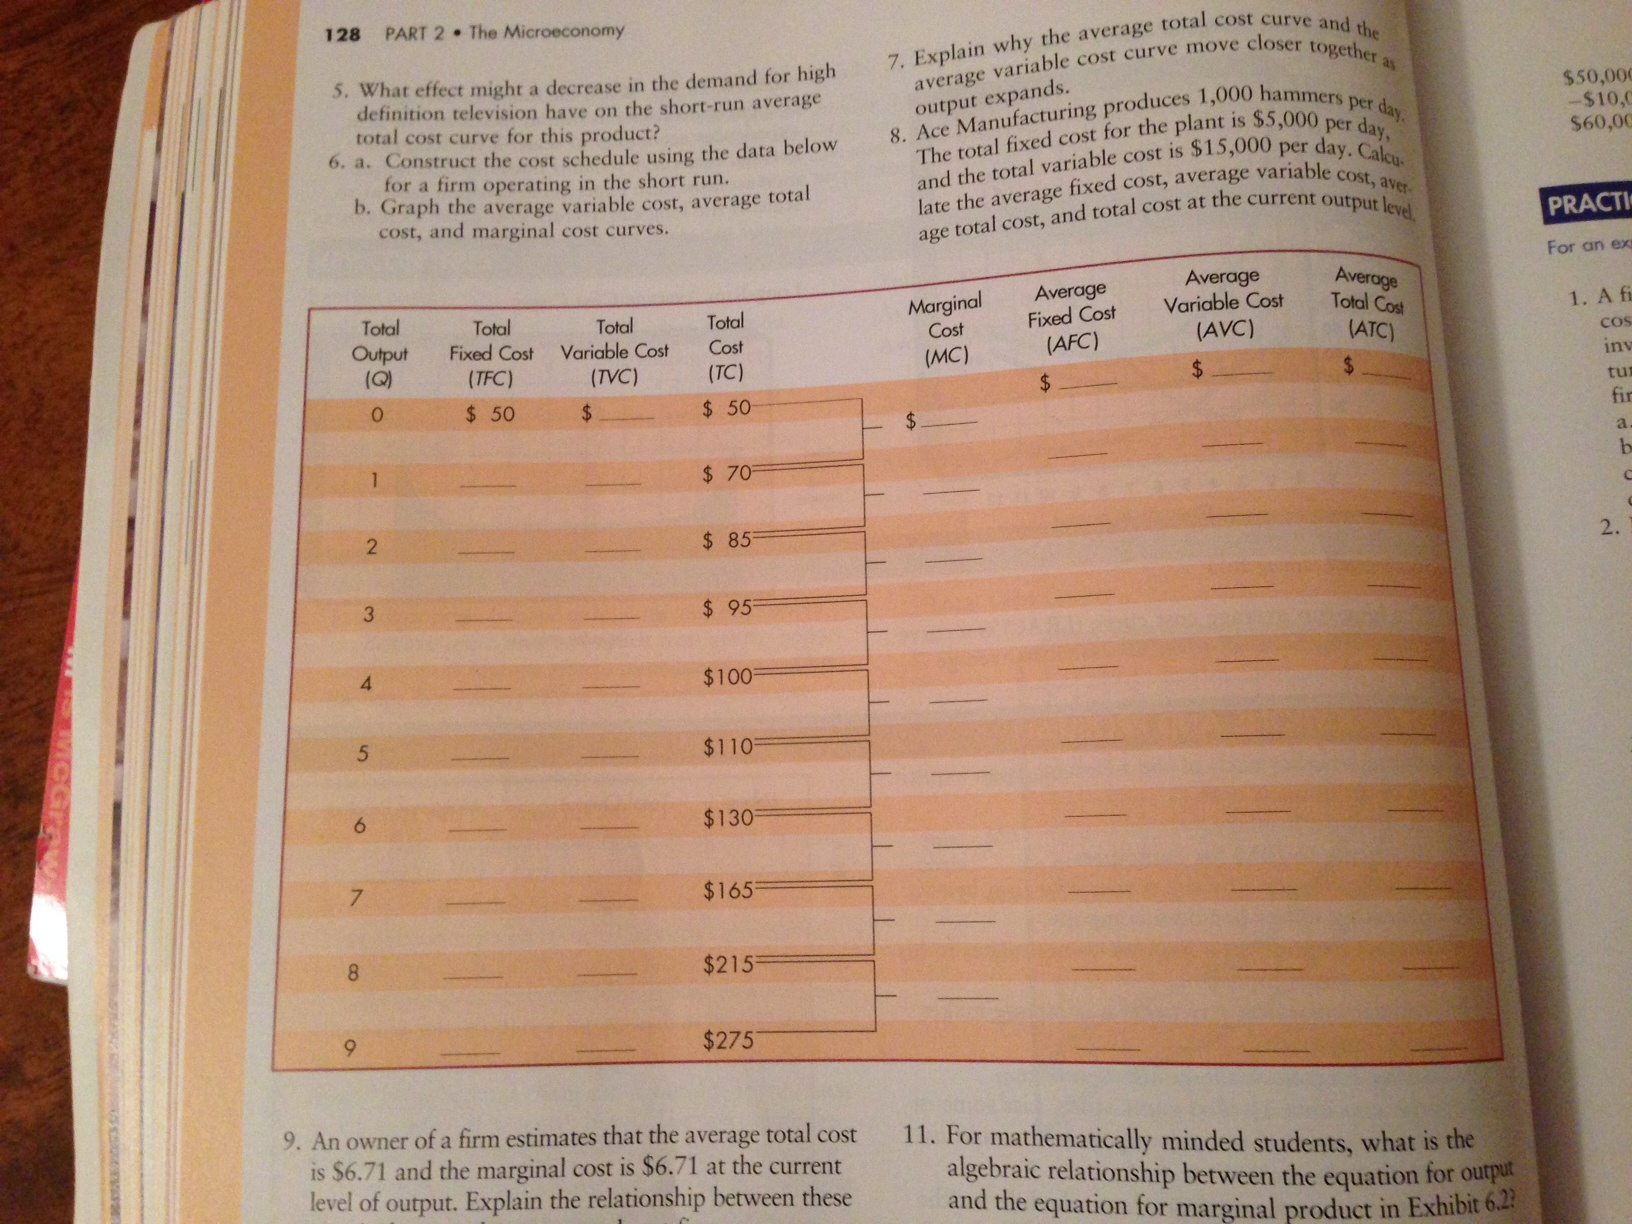
What effect might a decrease in the demand for high definition television have on the short-run average total cost curve for this product? Construct the cost schedule using the data below for a firm operating in the short run. Graph the average variable cost, average total cost, and marginal cost curves. Explain why the average total cost curve and the average variable cost curve move closer together as output expands. Ace Manufacturing produces 1,000 hammers per day. The fixed cost for the plant is $5,000 per day, and the total variable cost is $15,000 per day. Calculate the average fixed cost, average variable cost, average total cost, and total cost at current output level. An owner of a firm estimates that the average total cost is $6.71 and the marginal cost is $6.71 at the current level of output. Explain the relationship between these For mathematically minded students, what is the algebraic relationship between the equation tor and the equation for marginal product in Exhibit 6.2
Step by Step Solution
There are 3 Steps involved in it

Get step-by-step solutions from verified subject matter experts