

Question: 6. A formula, table, or graph that gives the possible values of , and the probability p (x] associated with each value of x a.
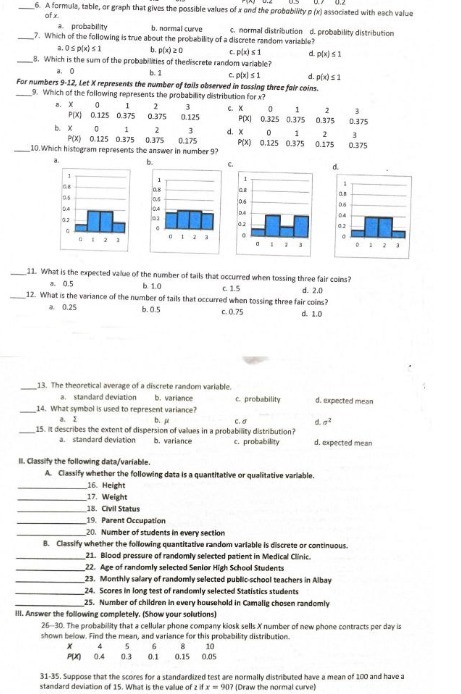
6. A formula, table, or graph that gives the possible values of , and the probability p (x] associated with each value of x a. probability b. normal curve & normal distribution d. probability distribution 7. Which of the following is true about the probability of a discrete random variable? a. 0 s p x) $1 b. p(x)20 d. p(x) $ 1 B. Which is the sum of the probabilities of thediscrete random variable? b. 1 cpix] $1 d. p(x) = 1 For numbers 9-17, Let X represents the novbey of fails observed in tossing three fow coins. P. Which of the following represents the probability cdistribution for x7 a. X 0 2 2 PIX) 0.125 0.375 0.375 0.125 P(X) 0.325 0.375 0.375 0.375 b X 1 2 3 d. x 1 2 Pyx) 0 125 0.375 0.375 0.175 P(X) 0.125 0.375 0.175 0.375 10. Which histogram represents the answer in number 97 11. What is the expected value of the number of tails that occurred when tossing three fair coins? 4. 0.5 b 1.0 C. 1.5 d. 2.0 12. What is the variance of the number of tails that occurred when tossing three fair coins? 2 0.25 b. 0.5 C. 0.75 d. 1.0 13. The theoretical average of a discrete random variable. a, standard deviation b, variance c. probability d. expected mean 14. What symbol is used to represent variance? b. p 15. I describes the extent of dispersion of values in a probability distribution? 1. standard deviation b. variance c. probability d. expected mean IL. Classify the following data/ variable. A. Classify whether the following data is a quantitative or qualitative variable. 16. Height 17, Weight 18. Civil Status 19. Parent Occupation 20. Number of students in every section B. Classify whether the following quantitative random variable is discrete or continuous. 21. Blood pressure of randomly selected patient in Medical Clinic. 22. Age of randomly selected Senior High School Students 23. Monthly salary of randomly selected public school teachers in Albay 24. Scores in long test of randomly selected Statistics students 25. Number of children in every household in Carnalig chosen randomly Ill. Answer the following completely. (Show your solutions] 26-30. The probability that a cellular phone company kiosk sells X number of new phone contracts per day is shown below. Find the mean, and variance for this probability distribution. 4 5 10 0.4 0.3 0.1 0.15 0.05 31-35. Suppose that the scores for a standardized test are normally distributed have a mean of 100 and have a standard deviation of 15, What is the value of : if r = 907 (Draw the normal curve)
Step by Step Solution
There are 3 Steps involved in it

Get step-by-step solutions from verified subject matter experts