

Question: 6. A researcher is interested in examining whether the frequency/proportion of yearly major medical problems is different depending upon the age group/category that someone belongs.
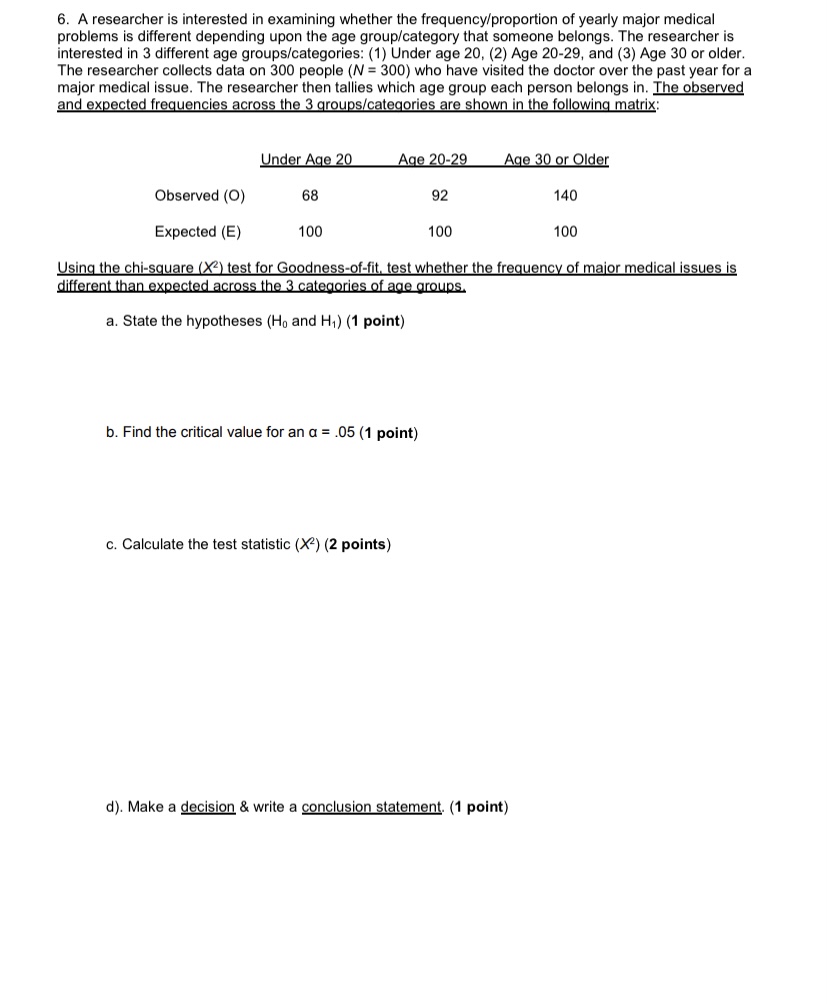
6. A researcher is interested in examining whether the frequency/proportion of yearly major medical problems is different depending upon the age group/category that someone belongs. The researcher is interested in 3 different age groups/categories: (1) Under age 20, (2) Age 20-29, and (3) Age 30 or older. The researcher collects data on 300 people (N = 300) who have visited the doctor over the past year for a major medical issue. The researcher then tallies which age group each person belongs in. The observed and expected frequencies across the 3 groups/categories are shown in the following matrix: Under Age 20 Age 20-29 Age 30 or Older Observed (O) 68 92 140 Expected (E) 100 100 100 Using the chi-square (X2) test for Goodness-of-fit, test whether the frequency of major medical issues is different than expected across the 3 categories of age groups. a. State the hypotheses (Ho and H1) (1 point) b. Find the critical value for an a = .05 (1 point) c. Calculate the test statistic (X2) (2 points) d). Make a decision & write a conclusion statement. (1 point)
Step by Step Solution
There are 3 Steps involved in it

Get step-by-step solutions from verified subject matter experts