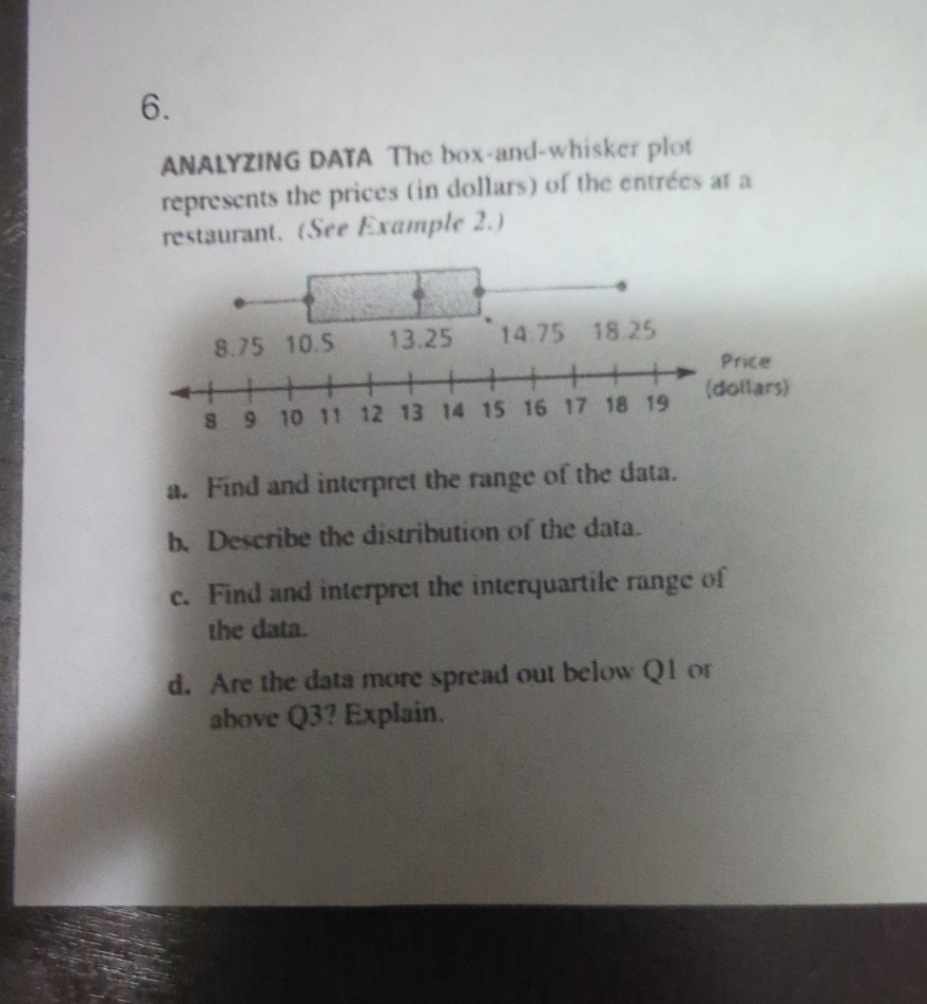
Question: 6. ANALYZING DATA The box-and-whisker plot represents the prices (in dollars) of the entrees at a restaurant. (See Example 2.) 8.75 10.5 13.25 14 75

6. ANALYZING DATA The box-and-whisker plot
6. ANALYZING DATA The box-and-whisker plot represents the prices (in dollars) of the entrees at a restaurant. (See Example 2.) 8.75 10.5 13.25 14 75 18.25 Price 8 9 10 11 12 13 14 15 16 17 18 19 (dollars) a. Find and interpret the range of the data. b. Describe the distribution of the data. c. Find and interpret the interquartile range of the data. d. Are the data more spread out below Q1 or above Q3? Explain

Step by Step Solution

There are 3 Steps involved in it

1 Expert Approved Answer
Step: 1 Unlock blur-text-image
Question Has Been Solved by an Expert!

Get step-by-step solutions from verified subject matter experts

Step: 2 Unlock
Step: 3 Unlock

Students Have Also Explored These Related Mathematics Questions!