

Question: 6- Based on the following data (10 Points) Subgroups 1 2 3 4 5 6 7 8 Mean 74.01 73.99 74.00 74.05 73.89 73.96 73.87
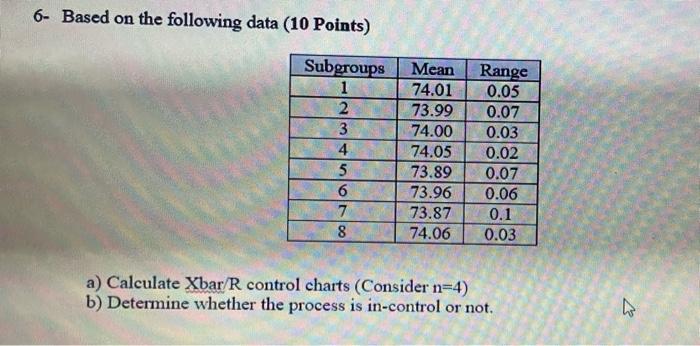
6- Based on the following data (10 Points) Subgroups 1 2 3 4 5 6 7 8 Mean 74.01 73.99 74.00 74.05 73.89 73.96 73.87 74.06 Range 0.05 0.07 0.03 0.02 0.07 0.06 0.1 0.03 a) Calculate Xbar/R control charts (Consider n=4) b) Determine whether the process is in-control or not. 6- Based on the following data (10 Points) Subgroups 1 2 3 4 5 6 7 8 Mean 74.01 73.99 74.00 74.05 73.89 73.96 73.87 74.06 Range 0.05 0.07 0.03 0.02 0.07 0.06 0.1 0.03 a) Calculate Xbar/R control charts (Consider n=4) b) Determine whether the process is in-control or not
Step by Step Solution
There are 3 Steps involved in it
1 Expert Approved Answer
Step: 1 Unlock

Question Has Been Solved by an Expert!
Get step-by-step solutions from verified subject matter experts
Step: 2 Unlock
Step: 3 Unlock