

Question: 6. Below are hypothetical quiz scores from two statistics classes. Use the data below to calculate Cohen's d effect size separately for each class and
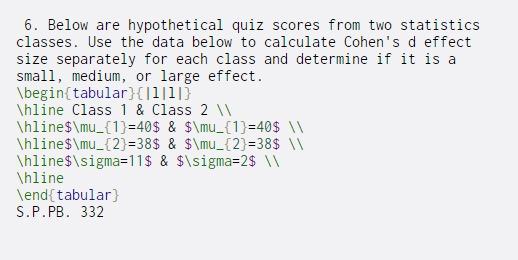
6. Below are hypothetical quiz scores from two statistics classes. Use the data below to calculate Cohen's d effect size separately for each class and determine if it is a small, medium, or large effect. \begin{tabular}{|111] \hline Class 1 & Class 2 \hline $\mu_{1}=40$ & $\mu_{1}=40$ W \hline $\mu_{2}=38$ & $\mu_{2}=38$ \hline $\sigma=11$ & $\sigma=2$ \hline \end{tabular) S.P.PB. 332
Step by Step Solution
There are 3 Steps involved in it
1 Expert Approved Answer
Step: 1 Unlock

Question Has Been Solved by an Expert!
Get step-by-step solutions from verified subject matter experts
Step: 2 Unlock
Step: 3 Unlock