

Question: 6. Below is a graph of a function f (3:) and a graph of its curvature K.($) at each value of m. Determine which graph
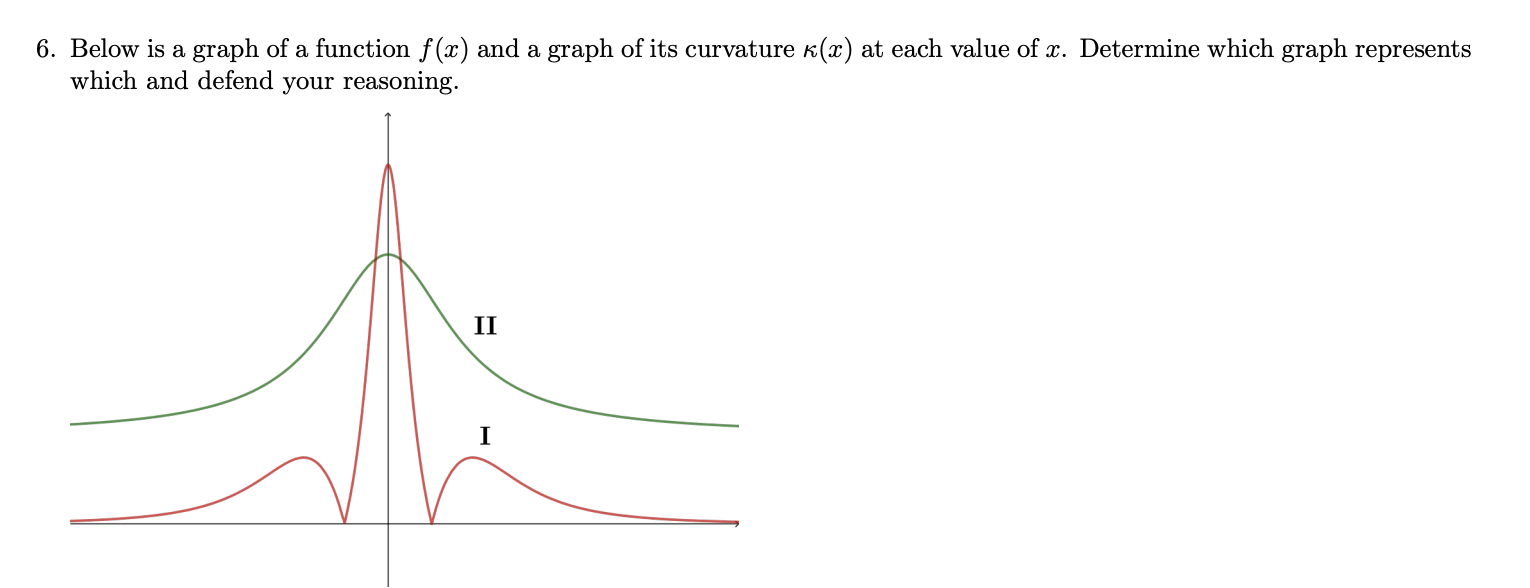

6. Below is a graph of a function f (3:) and a graph of its curvature K.($) at each value of m. Determine which graph represents which and defend your reasoning
Step by Step Solution
There are 3 Steps involved in it
1 Expert Approved Answer
Step: 1 Unlock

Question Has Been Solved by an Expert!
Get step-by-step solutions from verified subject matter experts
Step: 2 Unlock
Step: 3 Unlock