

Question: 6. Consider a sample with data values of 27, 25, 20, 15, 30, 34, 28 and 25. a. What is the minimum? (2 pts) b.
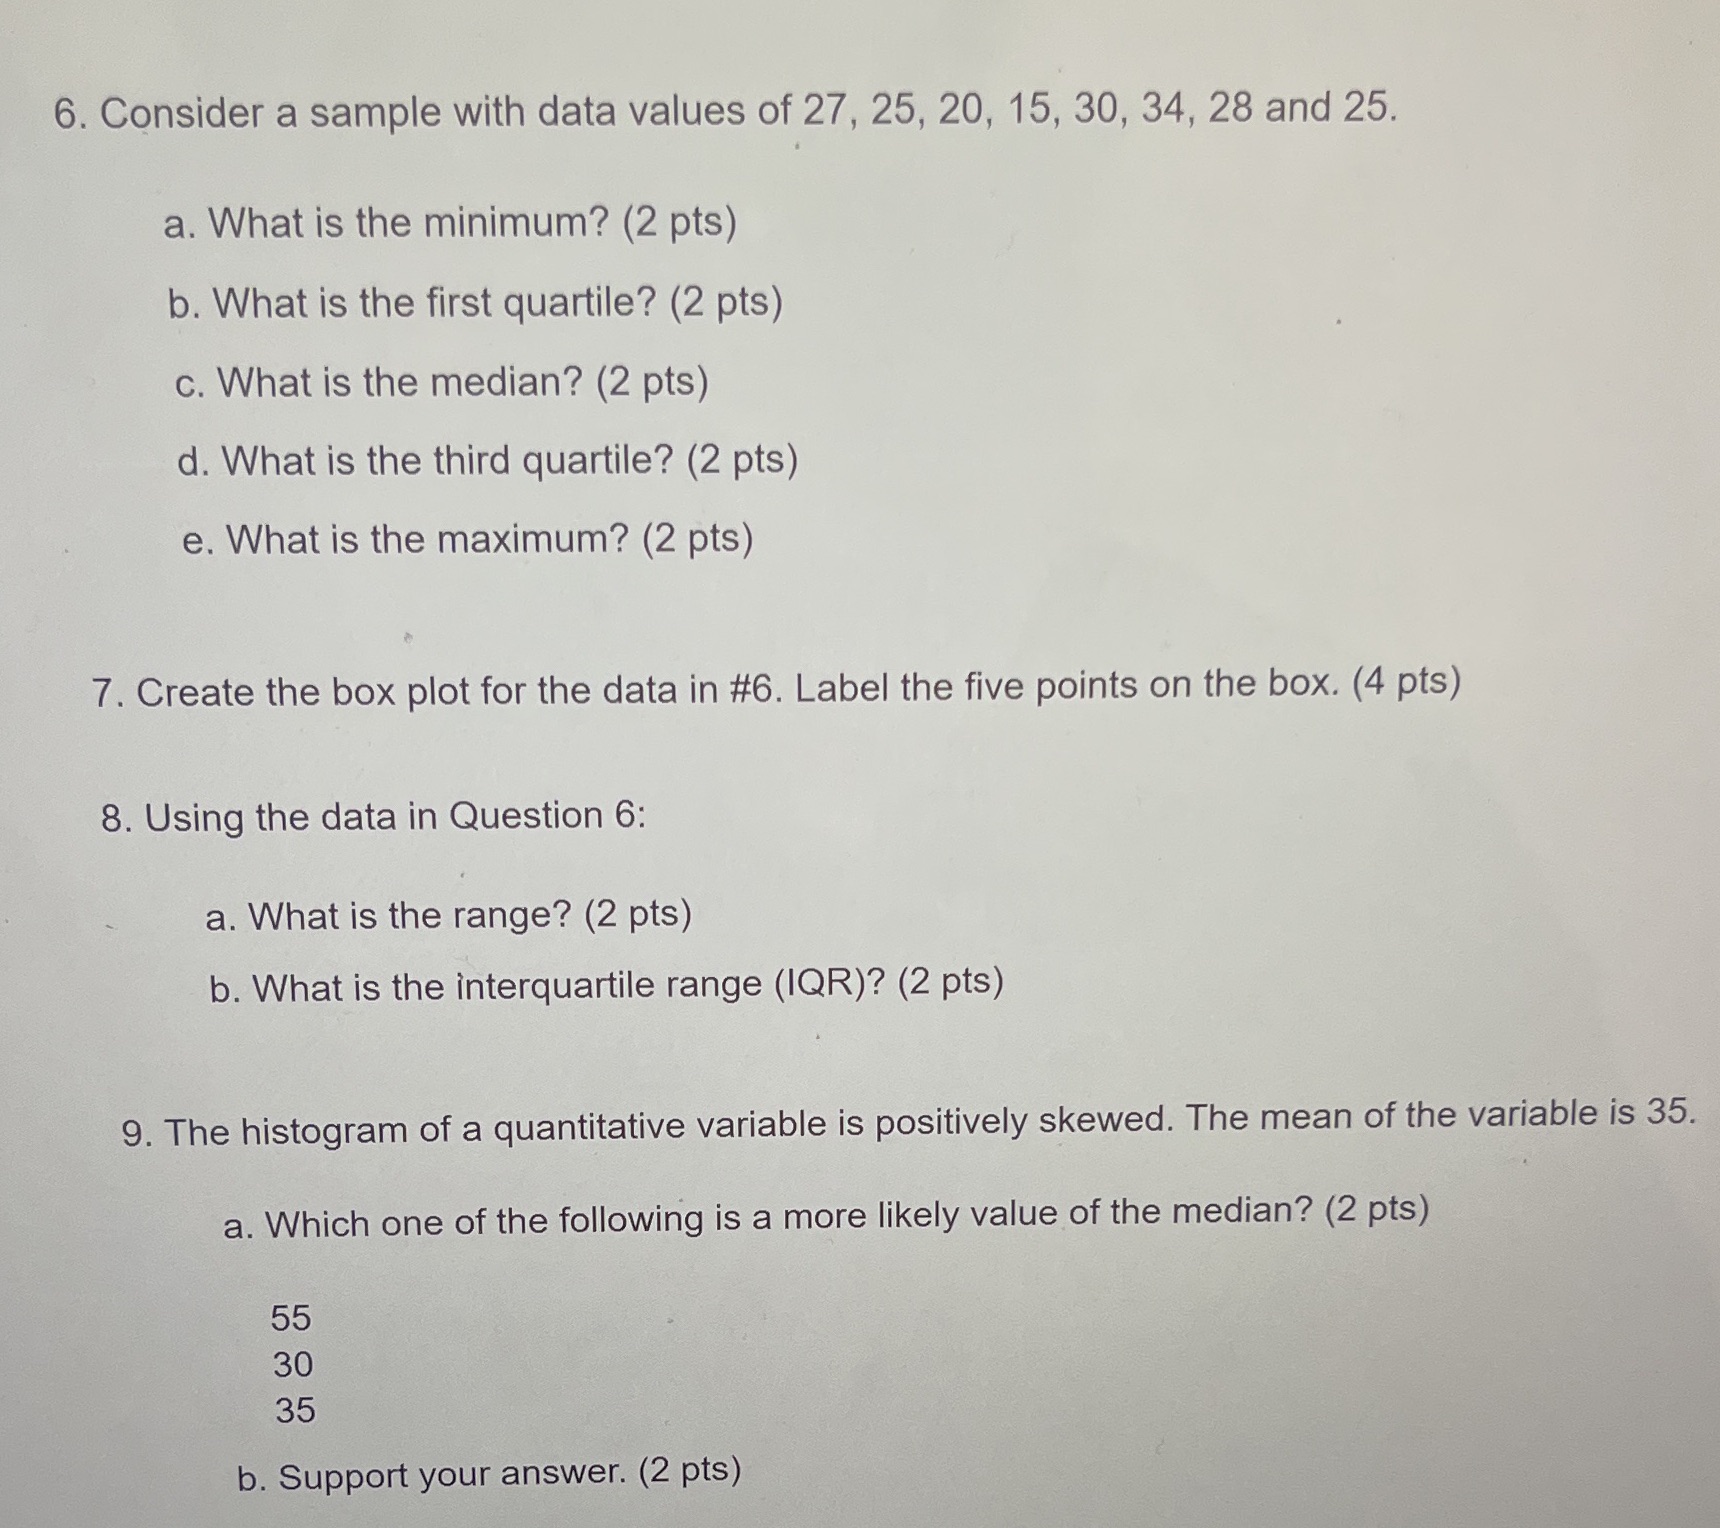
6. Consider a sample with data values of 27, 25, 20, 15, 30, 34, 28 and 25. a. What is the minimum? (2 pts) b. What is the first quartile? (2 pts) c. What is the median? (2 pts) d. What is the third quartile? (2 pts) e. What is the maximum? (2 pts) 7. Create the box plot for the data in #6. Label the five points on the box. (4 pts) 8. Using the data in Question 6: a. What is the range? (2 pts) b. What is the interquartile range (IQR)? (2 pts) 9. The histogram of a quantitative variable is positively skewed. The mean of the variable is 35. a. Which one of the following is a more likely value of the median? (2 pts) 55 30 35 b. Support your answer. (2 pts)
Step by Step Solution
There are 3 Steps involved in it

Get step-by-step solutions from verified subject matter experts