

Question: 6. Consider again the data and output from question 5. (a) What hypothesis is being tested by the F-statistic 111.5 on 4 and 61 degrees
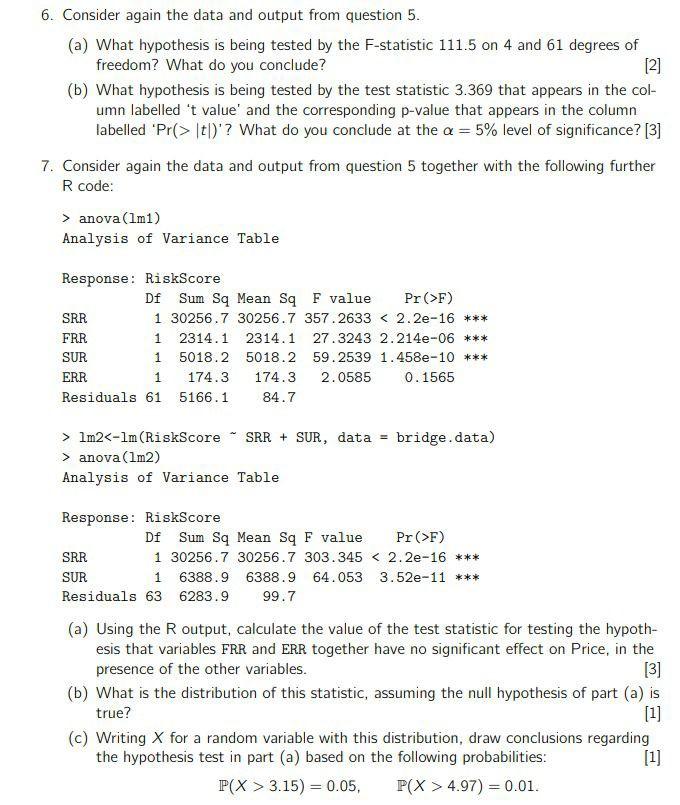
6. Consider again the data and output from question 5. (a) What hypothesis is being tested by the F-statistic 111.5 on 4 and 61 degrees of freedom? What do you conclude? [2] (b) What hypothesis is being tested by the test statistic 3.369 that appears in the col- umn labelled 't value' and the corresponding p-value that appears in the column labelled 'Pr(> \t\)'? What do you conclude at the a = 5% level of significance? [3] 7. Consider again the data and output from question 5 together with the following further R code: > anova (Im1) Analysis of Variance Table Response: RiskScore Df Sum Sq Mean Sq F value Pr>F) SRR 1 30256.7 30256.7 357.2633 lm2 anova(1m2) Analysis of Variance Table SRR Response: RiskScore Df Sum Sq Mean Sq F value Pr>F) 1 30256.7 30256.7 303.345 3.15) = 0.05, P(X > 4.97)=0.01. 6. Consider again the data and output from question 5. (a) What hypothesis is being tested by the F-statistic 111.5 on 4 and 61 degrees of freedom? What do you conclude? [2] (b) What hypothesis is being tested by the test statistic 3.369 that appears in the col- umn labelled 't value' and the corresponding p-value that appears in the column labelled 'Pr(> \t\)'? What do you conclude at the a = 5% level of significance? [3] 7. Consider again the data and output from question 5 together with the following further R code: > anova (Im1) Analysis of Variance Table Response: RiskScore Df Sum Sq Mean Sq F value Pr>F) SRR 1 30256.7 30256.7 357.2633 lm2 anova(1m2) Analysis of Variance Table SRR Response: RiskScore Df Sum Sq Mean Sq F value Pr>F) 1 30256.7 30256.7 303.345 3.15) = 0.05, P(X > 4.97)=0.01
Step by Step Solution
There are 3 Steps involved in it
1 Expert Approved Answer
Step: 1 Unlock

Question Has Been Solved by an Expert!
Get step-by-step solutions from verified subject matter experts
Step: 2 Unlock
Step: 3 Unlock