

Question: 6. Consider the data in Table 2. Suppose a simple economy produces three goods only. The price and output data for some selected years are
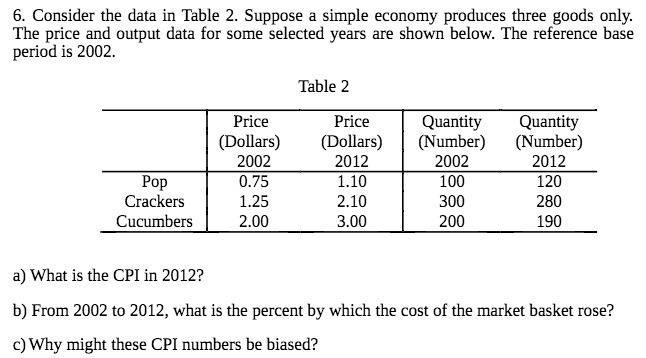
6. Consider the data in Table 2. Suppose a simple economy produces three goods only. The price and output data for some selected years are shown below. The reference base period is 2002. Table 2 Price Price Quantityr Quantityr (Dollars) (Dollars) (Number) (Number) 2002 2012 2002 2012 Pop 0.25 1.10 100 120 Crackers 1-25 2.10 300 200 Cucumbers 2.00 3.00 200 190 a] What is the CPI in 2012? b) From 2002 to 2012, what is the percent by which the cost of the market basket rose? c)Why might these CPI numbers be biased
Step by Step Solution
There are 3 Steps involved in it
1 Expert Approved Answer
Step: 1 Unlock

Question Has Been Solved by an Expert!
Get step-by-step solutions from verified subject matter experts
Step: 2 Unlock
Step: 3 Unlock