

Question: 6. Consider the following data from a random sample of 660 jurors selected for grand juries in a city. We are interested in finding
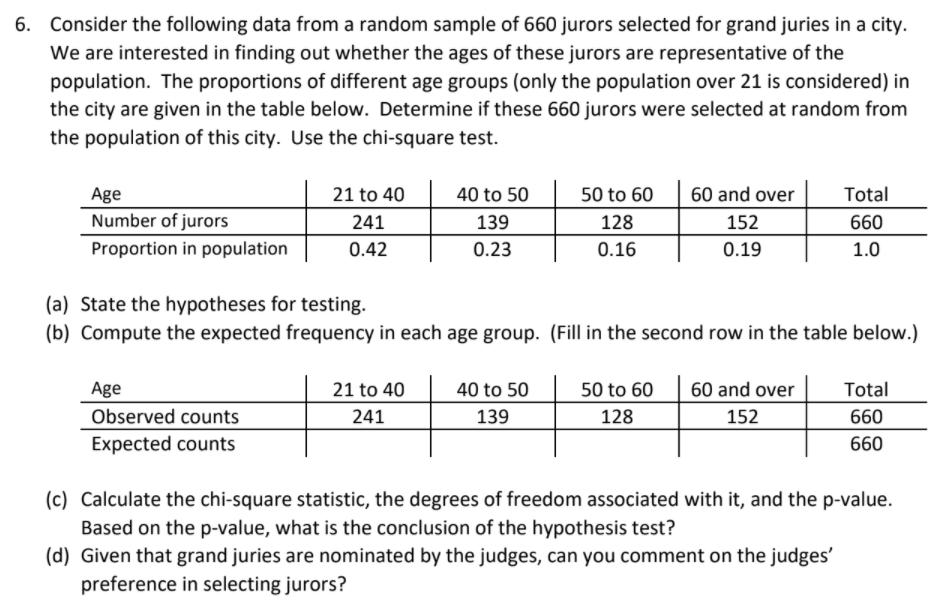
6. Consider the following data from a random sample of 660 jurors selected for grand juries in a city. We are interested in finding out whether the ages of these jurors are representative of the population. The proportions of different age groups (only the population over 21 is considered) in the city are given in the table below. Determine if these 660 jurors were selected at random from the population of this city. Use the chi-square test. Age 21 to 40 40 to 50 50 to 60 60 and over Total Number of jurors 241 139 128 152 660 Proportion in population 0.42 0.23 0.16 0.19 1.0 (a) State the hypotheses for testing. (b) Compute the expected frequency in each age group. (Fill in the second row in the table below.) Age 21 to 40 Total 40 to 50 139 50 to 60 60 and over 128 152 Observed counts 241 660 Expected counts 660 (c) Calculate the chi-square statistic, the degrees of freedom associated with it, and the p-value. Based on the p-value, what is the conclusion of the hypothesis test? (d) Given that grand juries are nominated by the judges, can you comment on the judges' preference in selecting jurors?
Step by Step Solution
There are 3 Steps involved in it

Get step-by-step solutions from verified subject matter experts