

Question: 6. Consider the frequency distribution shown in the below. class interval f cum f cum % 45-49 128 100.00 40-44 6 126 98.44 35-39 15
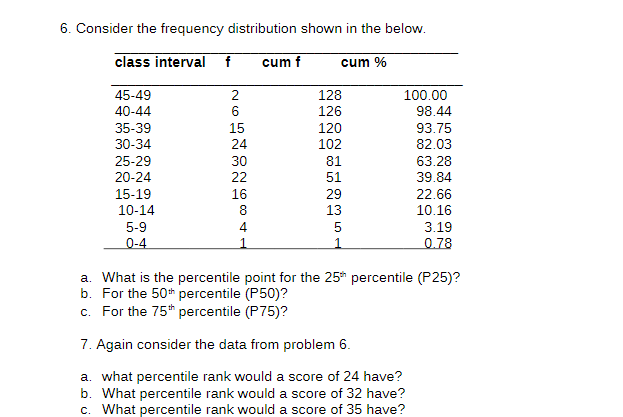
6. Consider the frequency distribution shown in the below. class interval f cum f cum % 45-49 128 100.00 40-44 6 126 98.44 35-39 15 120 93.75 30-34 24 102 82.03 25-29 30 81 63.28 20-24 22 51 39.84 15-19 16 29 22.66 10-14 8 13 10.16 5-9 4 5 3.19 0-4 0.78 a. What is the percentile point for the 25* percentile (P25)? b. For the 50* percentile (P50)? c. For the 75* percentile (P75)? 7. Again consider the data from problem 6. a. what percentile rank would a score of 24 have? b. What percentile rank would a score of 32 have? c. What percentile rank would a score of 35 have
Step by Step Solution
There are 3 Steps involved in it
1 Expert Approved Answer
Step: 1 Unlock

Question Has Been Solved by an Expert!
Get step-by-step solutions from verified subject matter experts
Step: 2 Unlock
Step: 3 Unlock