

Question: 6. Construct a sensitivity analysis for units sold (quantities are listed in Column B starting in Row 19). Define a data table using Excels What-If
6. Construct a sensitivity analysis for units sold (quantities are listed in Column B starting in Row 19). Define a data table using Excels What-If Analysis located in the data tab. (6 points) a. The table should include the IRR, NPV, and Decision for each quantity; i.e. for each quantity Excel will calculate these three items in the table which will extend from C19 to E27. b. Use conditional formatting (found in the Home tab) to highlight the NPV in red if the NPV is negative, and green if it is positive. Use a conditional format to highlight the IRR in red if the IRR is greater than the cost of capital, and in green if it is less than the cost of capital.
7. Define a base-case, best-case and worst-case scenario using the Scenario Manager in Excels What-If Analysis. Use the following value ranges for the best and worst cases: (6 points) a. Per unit price is plus/minus $5 b. Quantity sold is plus/minus 15,000 units c. Marginal cost of producing a widget is plus/minus $1.50
8. Using the Scenario Manager, create a scenario summary. (4 points)
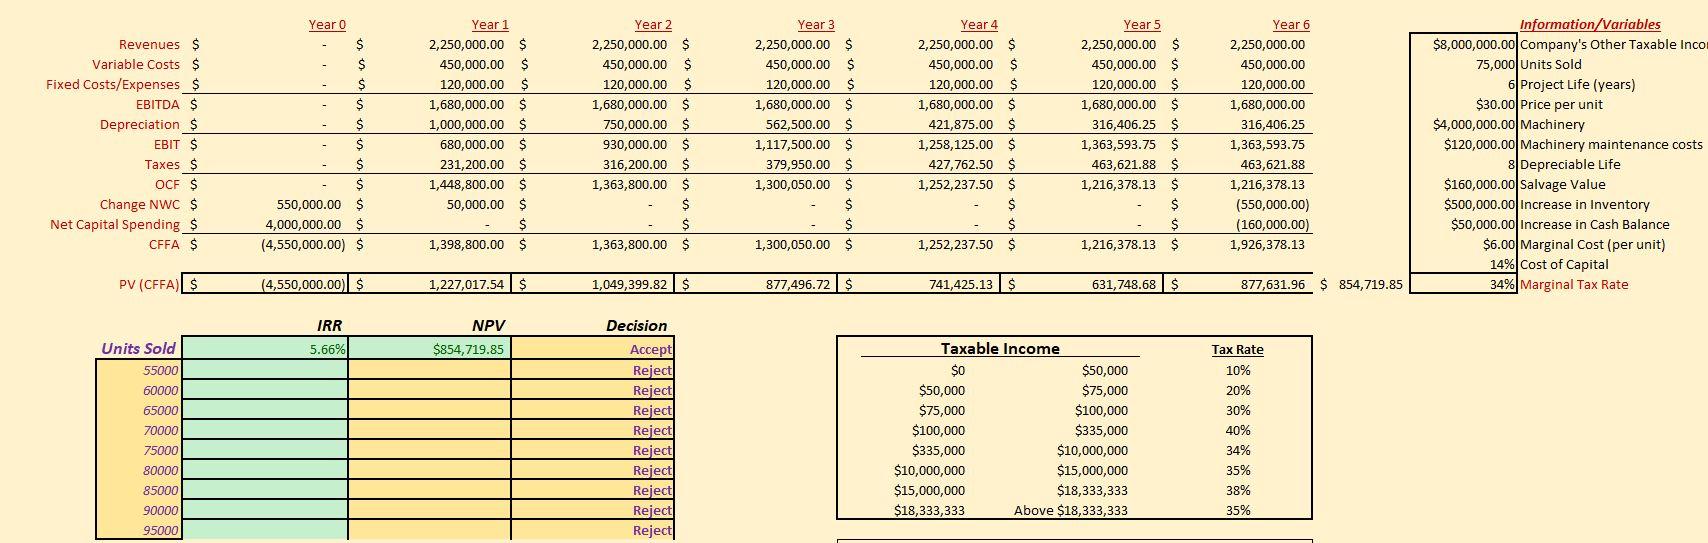
Revenues $ Variable Costs $ Fixed Costs/Expenses $ EBITDA $ Depreciation $ EBIT $ Taxes $ OCF $ Change NWC $ Net Capital Spending $ CFFA $ Year o $ $ $ $ $ $ $ $ 550,000.00 $ 4,000,000.00 $ (4,550,000.00) $ Year 1 2,250,000.00 $ 450,000.00 $ 120,000.00 $ 1,680,000.00 $ 1,000,000.00 $ 680,000.00 $ 231,200.00 S 1,448,800.00 $ 50,000.00 $ $ 1,398,800.00 $ Year 2 2,250,000.00 $ 450,000.00 $ 120,000.00 $ 1,680,000.00 $ 750,000.00 $ 930,000.00 $ 316,200.00 $ 1,363,800.00 $ S $ 1,363,800.00 $ Year 3 2,250,000.00 $ 450,000.00 120,000.00 S 1,680,000.00 $ 562,500.00 $ 1,117,500.00 $ 379,950.00 $ 1,300,050.00 $ $ $ 1,300,050.00 $ Year 4 2,250,000.00 $ 450,000.00 $ 120,000.00 $ 1,680,000.00 $ 421,875.00 $ 1,258,125.00 $ 427,762.50 S 1,252,237.50 $ $ $ 1,252,237.50 $ Year 5 2,250,000.00 $ 450,000.00 $ 120,000.00 $ 1,680,000.00 $ 316,406.25 $ 1,363,593.75 $ 463,621.88 S 1,216,378.13 $ $ $ 1,216,378.13 $ Year 6 2,250,000.00 450,000.00 120,000.00 1,680,000.00 316,406.25 1,363,593.75 463,621.88 1,216,378.13 (550,000.00) (160,000.00) 1,926,378.13 Information/Variables $8,000,000.00 Company's Other Taxable incom 75,000 Units Sold 6 Project Life (years) $30.00 Price per unit $4,000,000.00 Machinery $120,000.00 Machinery maintenance costs 8 Depreciable Life $160,000.00 Salvage Value $500,000.00 Increase in Inventory $50,000.00 Increase in Cash Balance $6.00 Marginal Cost (per unit) 14% Cost of Capital 34% Marginal Tax Rate PV (CFFA) $ (4,550,000.00 $ 1,227,017.54 $ 1,049,399.82 $ 877,496.72 $ 741,425.13 $ 631,748.68 $ 877,631.96 $ 854,719.85 IRR NPV 5.66% $854,719.85 Units Sold 55000 60000 65000 70000 75000 80000 85000 90000 95000 Decision Accept Reject Reject Reject Reject Reject Reject Taxable income $0 $50,000 $50,000 $75,000 $75,000 $100,000 $100,000 $335,000 $335,000 $10,000,000 $10,000,000 $15,000,000 $15,000,000 $18,333,333 $18,333,333 Above $18,333,333 Tax Rate 10% 20% 30% 40% 34% 35% 38% 35% Reject Reject Reject Revenues $ Variable Costs $ Fixed Costs/Expenses $ EBITDA $ Depreciation $ EBIT $ Taxes $ OCF $ Change NWC $ Net Capital Spending $ CFFA $ Year o $ $ $ $ $ $ $ $ 550,000.00 $ 4,000,000.00 $ (4,550,000.00) $ Year 1 2,250,000.00 $ 450,000.00 $ 120,000.00 $ 1,680,000.00 $ 1,000,000.00 $ 680,000.00 $ 231,200.00 S 1,448,800.00 $ 50,000.00 $ $ 1,398,800.00 $ Year 2 2,250,000.00 $ 450,000.00 $ 120,000.00 $ 1,680,000.00 $ 750,000.00 $ 930,000.00 $ 316,200.00 $ 1,363,800.00 $ S $ 1,363,800.00 $ Year 3 2,250,000.00 $ 450,000.00 120,000.00 S 1,680,000.00 $ 562,500.00 $ 1,117,500.00 $ 379,950.00 $ 1,300,050.00 $ $ $ 1,300,050.00 $ Year 4 2,250,000.00 $ 450,000.00 $ 120,000.00 $ 1,680,000.00 $ 421,875.00 $ 1,258,125.00 $ 427,762.50 S 1,252,237.50 $ $ $ 1,252,237.50 $ Year 5 2,250,000.00 $ 450,000.00 $ 120,000.00 $ 1,680,000.00 $ 316,406.25 $ 1,363,593.75 $ 463,621.88 S 1,216,378.13 $ $ $ 1,216,378.13 $ Year 6 2,250,000.00 450,000.00 120,000.00 1,680,000.00 316,406.25 1,363,593.75 463,621.88 1,216,378.13 (550,000.00) (160,000.00) 1,926,378.13 Information/Variables $8,000,000.00 Company's Other Taxable incom 75,000 Units Sold 6 Project Life (years) $30.00 Price per unit $4,000,000.00 Machinery $120,000.00 Machinery maintenance costs 8 Depreciable Life $160,000.00 Salvage Value $500,000.00 Increase in Inventory $50,000.00 Increase in Cash Balance $6.00 Marginal Cost (per unit) 14% Cost of Capital 34% Marginal Tax Rate PV (CFFA) $ (4,550,000.00 $ 1,227,017.54 $ 1,049,399.82 $ 877,496.72 $ 741,425.13 $ 631,748.68 $ 877,631.96 $ 854,719.85 IRR NPV 5.66% $854,719.85 Units Sold 55000 60000 65000 70000 75000 80000 85000 90000 95000 Decision Accept Reject Reject Reject Reject Reject Reject Taxable income $0 $50,000 $50,000 $75,000 $75,000 $100,000 $100,000 $335,000 $335,000 $10,000,000 $10,000,000 $15,000,000 $15,000,000 $18,333,333 $18,333,333 Above $18,333,333 Tax Rate 10% 20% 30% 40% 34% 35% 38% 35% Reject Reject Reject
Step by Step Solution
There are 3 Steps involved in it

Get step-by-step solutions from verified subject matter experts