

Question: 6. Create a two-way data table that measures NPV as a function of the growth in cups sold and the cup prices. what should i
6. Create a two-way data table that measures NPV as a function of the growth in cups sold and the cup prices.
what should i put in data table ?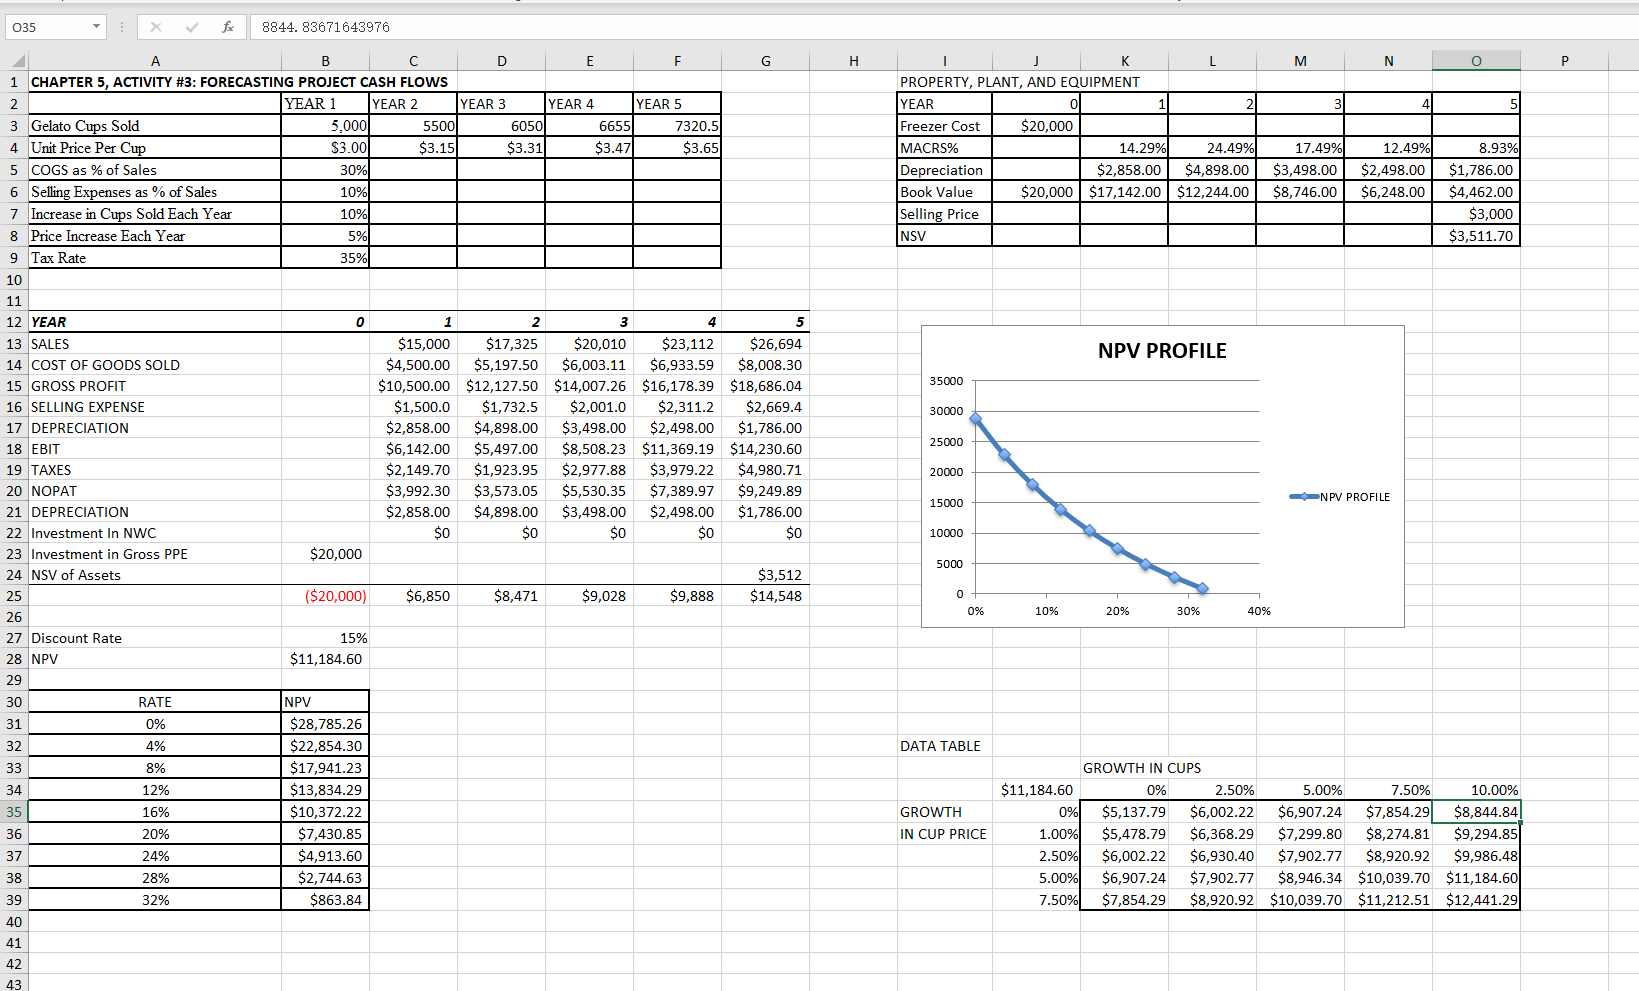
035 X f 8844. 83671643976 G H M N 0 P 3 4 5 A B C D E F 1 CHAPTER 5, ACTIVITY #3: FORECASTING PROJECT CASH FLOWS 2 YEAR 1 YEAR 2 YEAR 3 YEAR 4 YEAR 5 3 Gelato Cups Sold 5.000 5500 6050 6655 7320.5 4 Unit Price Per Cup $3.001 $3.15 $3.31 $3.47 $3.65) 5 COGS as % of Sales 30% 6 Selling Expenses as % of Sales 10% 7 Increase in Cups Sold Each Year 10% 8 Price Increase Each Year 5% 9 Tax Rate 35% 10 J K L PROPERTY, PLANT, AND EQUIPMENT YEAR 0 Freezer Cost $20,000 MACRS% 14.29% 24.49% Depreciation $2,858.00 $4,898.00 Book Value $20,000 $17,142.00 $12,244.00 Selling Price NSV 17.49% $3,498.00 $8,746.00 12.49% $2,498.00 $6,248.00 8.93% $1,786.00 $4,462.00 $3,000 $3,511.70 11 0 NPV PROFILE 35000 30000 2 3 4 5 $15,000 $17,325 $20,010 $23,112 $26,694 $4,500.00 $5,197.50 $6,003.11 $6,933.59 $8,008.30 $10,500.00 $12,127.50 $14,007.26 $16,178.39 $18,686.04 $1,500.0 $1,732.5 $2,001.0 $2,311.2 $2,669.4 $2,858.00 $4,898.00 $3,498.00 $2,498.00 $1,786.00 $6,142.00 $5,497.00 $8,508.23 $11,369.19 $14,230.60 $2,149.70 $1,923.95 $2,977.88 $3,979.22 $4,980.71 $3,992.30 $3,573.05 $5,530.35 $7,389.97 $9,249.89 $2,858.00 $4,898.00 $3,498.00 $2,498.00 $1,786.00 $0 $0 $0 $0 $0 25000 12 YEAR 13 SALES 14 COST OF GOODS SOLD 15 GROSS PROFIT 16 SELLING EXPENSE 17 DEPRECIATION 18 EBIT 19 TAXES 20 NOPAT 21 DEPRECIATION 22 Investment In NWC 23 Investment in Gross PPE 24 NSV of Assets 25 26 27 Discount Rate 28 NPV 20000 15000 NPV PROFILE 10000 $20,000 5000 $3,512 $14,548 ($20,000) $6,850 $8,471 $9,028 $9,888 0 0% 10% 20% 30% 40% 15% $11,184.60 29 RATE 30 31 32 0% 4% DATA TABLE 33 8% 34 35 NPV $28,785.26 $22,854.30 $17,941.23 $13,834.29 $10,372.22 $7,430.85 $4,913.60 $2,744.63 $863.84 GROWTH IN CUP PRICE 12% 16% 20% 24% 28% 32% 36 $11,184.60 0% 1.00% 2.50% 5.00% 7.50% GROWTH IN CUPS 0% 2.50% $5,137.79 $6,002.22 $5,478.79 $6,368.29 $6,002.22 $6,930.40 $6,907.24 $7,902.77 $7,854.29 $8,920.92 5.00% 7.50% 10.00% $6,907.24 $7,854.291 $8,844.84 $7,299.80 $8,274.81 $9,294.85 $7,902.77 $8,920.92 $9,986.48 $8,946.34 $10,039.70 $11,184.60 $10,039.70 $11,212.51 $12,441.29 37 38 39 40 41 42 43 035 X f 8844. 83671643976 G H M N 0 P 3 4 5 A B C D E F 1 CHAPTER 5, ACTIVITY #3: FORECASTING PROJECT CASH FLOWS 2 YEAR 1 YEAR 2 YEAR 3 YEAR 4 YEAR 5 3 Gelato Cups Sold 5.000 5500 6050 6655 7320.5 4 Unit Price Per Cup $3.001 $3.15 $3.31 $3.47 $3.65) 5 COGS as % of Sales 30% 6 Selling Expenses as % of Sales 10% 7 Increase in Cups Sold Each Year 10% 8 Price Increase Each Year 5% 9 Tax Rate 35% 10 J K L PROPERTY, PLANT, AND EQUIPMENT YEAR 0 Freezer Cost $20,000 MACRS% 14.29% 24.49% Depreciation $2,858.00 $4,898.00 Book Value $20,000 $17,142.00 $12,244.00 Selling Price NSV 17.49% $3,498.00 $8,746.00 12.49% $2,498.00 $6,248.00 8.93% $1,786.00 $4,462.00 $3,000 $3,511.70 11 0 NPV PROFILE 35000 30000 2 3 4 5 $15,000 $17,325 $20,010 $23,112 $26,694 $4,500.00 $5,197.50 $6,003.11 $6,933.59 $8,008.30 $10,500.00 $12,127.50 $14,007.26 $16,178.39 $18,686.04 $1,500.0 $1,732.5 $2,001.0 $2,311.2 $2,669.4 $2,858.00 $4,898.00 $3,498.00 $2,498.00 $1,786.00 $6,142.00 $5,497.00 $8,508.23 $11,369.19 $14,230.60 $2,149.70 $1,923.95 $2,977.88 $3,979.22 $4,980.71 $3,992.30 $3,573.05 $5,530.35 $7,389.97 $9,249.89 $2,858.00 $4,898.00 $3,498.00 $2,498.00 $1,786.00 $0 $0 $0 $0 $0 25000 12 YEAR 13 SALES 14 COST OF GOODS SOLD 15 GROSS PROFIT 16 SELLING EXPENSE 17 DEPRECIATION 18 EBIT 19 TAXES 20 NOPAT 21 DEPRECIATION 22 Investment In NWC 23 Investment in Gross PPE 24 NSV of Assets 25 26 27 Discount Rate 28 NPV 20000 15000 NPV PROFILE 10000 $20,000 5000 $3,512 $14,548 ($20,000) $6,850 $8,471 $9,028 $9,888 0 0% 10% 20% 30% 40% 15% $11,184.60 29 RATE 30 31 32 0% 4% DATA TABLE 33 8% 34 35 NPV $28,785.26 $22,854.30 $17,941.23 $13,834.29 $10,372.22 $7,430.85 $4,913.60 $2,744.63 $863.84 GROWTH IN CUP PRICE 12% 16% 20% 24% 28% 32% 36 $11,184.60 0% 1.00% 2.50% 5.00% 7.50% GROWTH IN CUPS 0% 2.50% $5,137.79 $6,002.22 $5,478.79 $6,368.29 $6,002.22 $6,930.40 $6,907.24 $7,902.77 $7,854.29 $8,920.92 5.00% 7.50% 10.00% $6,907.24 $7,854.291 $8,844.84 $7,299.80 $8,274.81 $9,294.85 $7,902.77 $8,920.92 $9,986.48 $8,946.34 $10,039.70 $11,184.60 $10,039.70 $11,212.51 $12,441.29 37 38 39 40 41 42 43
Step by Step Solution
There are 3 Steps involved in it

Get step-by-step solutions from verified subject matter experts