

Question: 6 Does the graph shown represent a function Explain In A The graph represents a function because there is exactly one y value for each
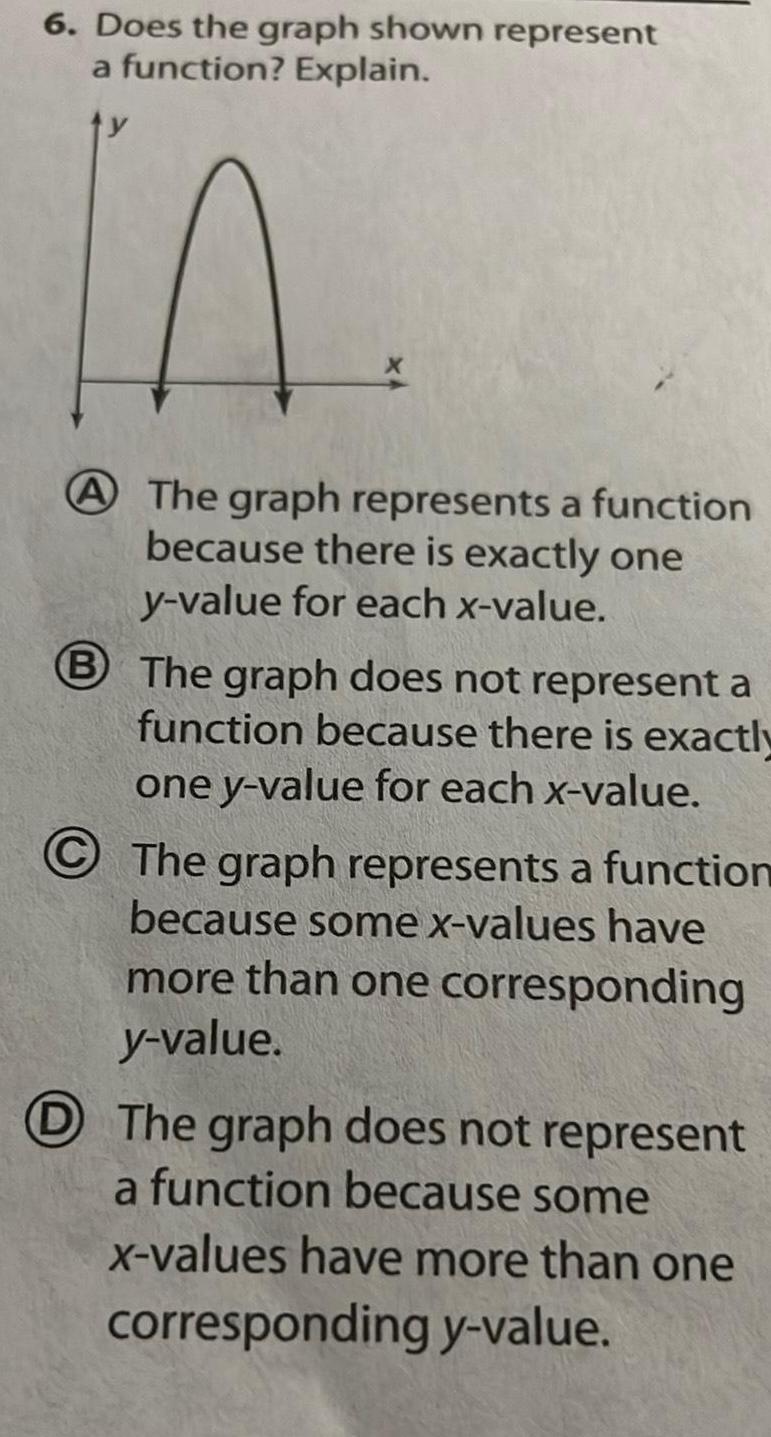

6 Does the graph shown represent a function Explain In A The graph represents a function because there is exactly one y value for each x value B The graph does not represent a function because there is exactly one y value for each x value The graph represents a function because some x values have more than one corresponding y value D The graph does not represent a function because some x values have more than one corresponding y value
Step by Step Solution
There are 3 Steps involved in it
1 Expert Approved Answer
Step: 1 Unlock

Question Has Been Solved by an Expert!
Get step-by-step solutions from verified subject matter experts
Step: 2 Unlock
Step: 3 Unlock