

Question: 6 . For the following graph : 2 ) Determine the intervals between which the rate of change is positive and negative . ( 2
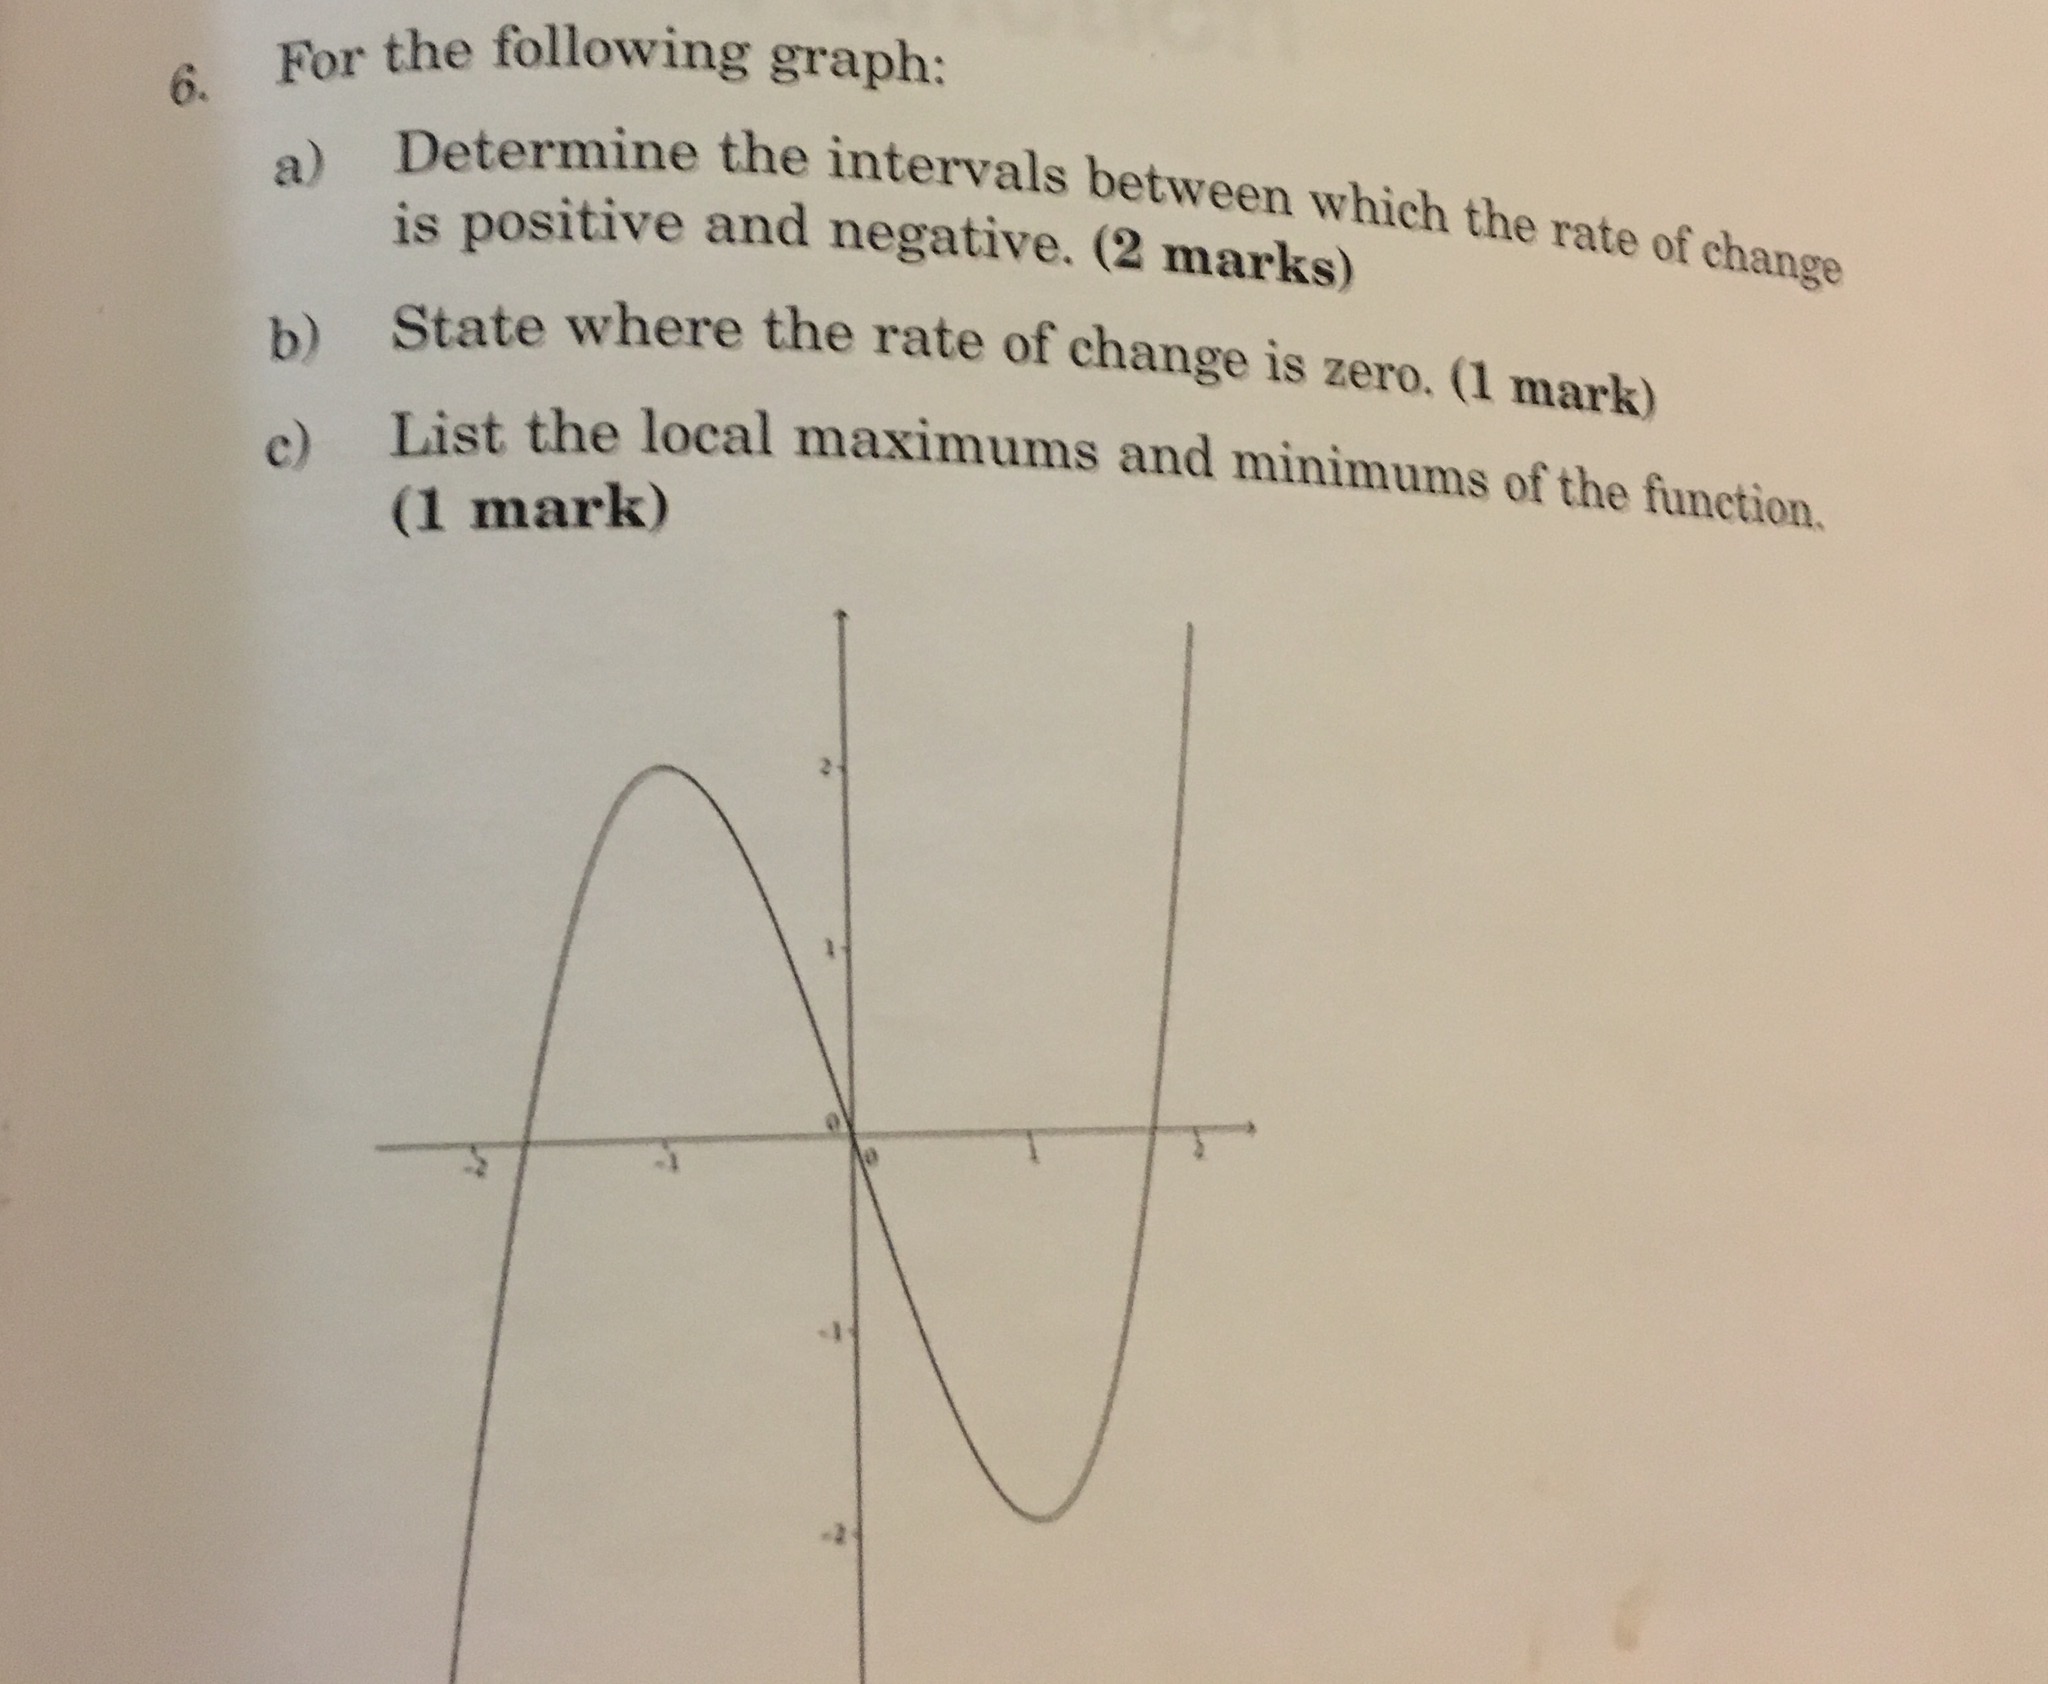
6 . For the following graph :" 2 ) Determine the intervals between which the rate of change is positive and negative . ( 2 marks ) b ) State where the rate of change is zero . ( 1 mark ) C ) List the local maximums and minimums of the function . ( 1 mark )
Step by Step Solution
There are 3 Steps involved in it
1 Expert Approved Answer
Step: 1 Unlock

Question Has Been Solved by an Expert!
Get step-by-step solutions from verified subject matter experts
Step: 2 Unlock
Step: 3 Unlock