

Question: 6. Given the following data, compute MAD, MSE, and MAPE for the following data. Then, please compute the standard deviation of forecast error using the
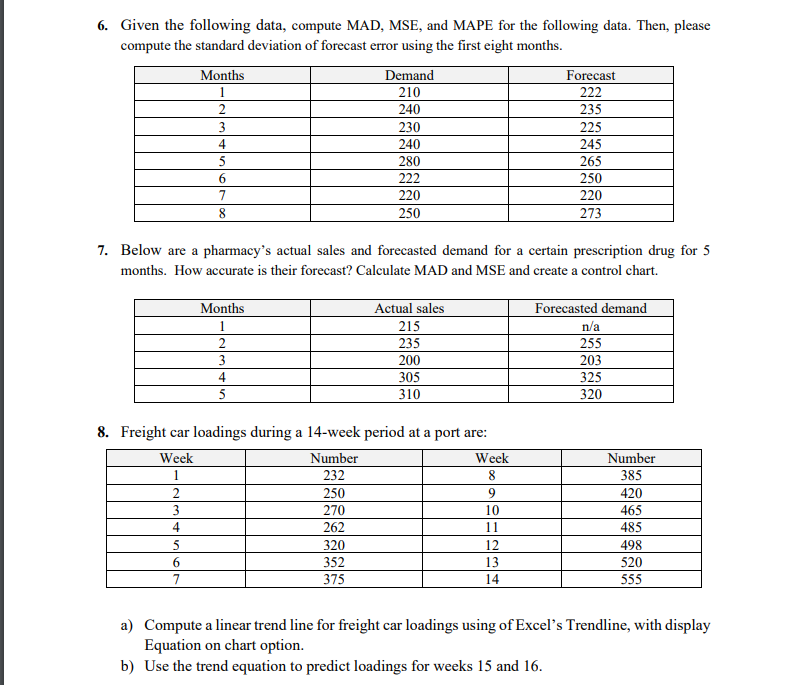
6. Given the following data, compute MAD, MSE, and MAPE for the following data. Then, please compute the standard deviation of forecast error using the first eight months. 7. Below are a pharmacy's actual sales and forecasted demand for a certain prescription drug for 5 months. How accurate is their forecast? Calculate MAD and MSE and create a control chart. 8. Freight car loadings during a 14-week period at a port are: a) Compute a linear trend line for freight car loadings using of Excel's Trendline, with display Equation on chart option. b) Use the trend equation to predict loadings for weeks 15 and 16
Step by Step Solution
There are 3 Steps involved in it
1 Expert Approved Answer
Step: 1 Unlock

Question Has Been Solved by an Expert!
Get step-by-step solutions from verified subject matter experts
Step: 2 Unlock
Step: 3 Unlock