

Question: 6. Here are three histograms. Histogram A Histogram B Histogram C 60 60 60 50 50 50 40 40 40 30 30 30 20 20
6.
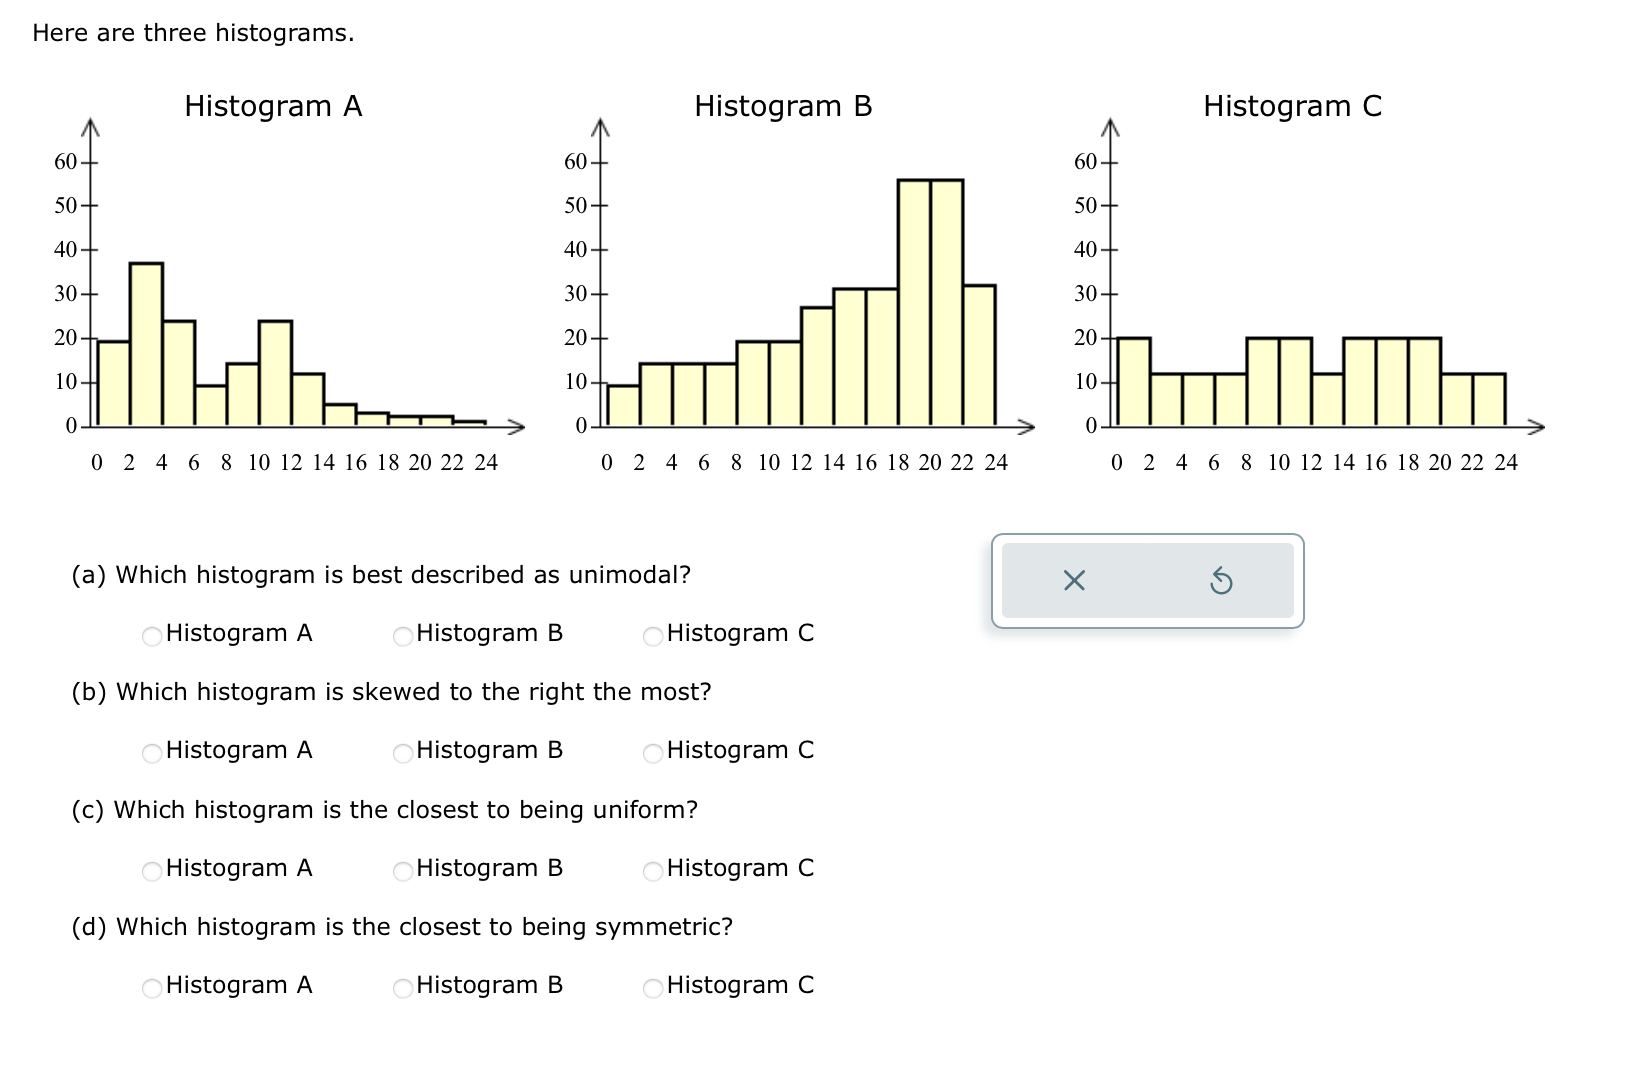
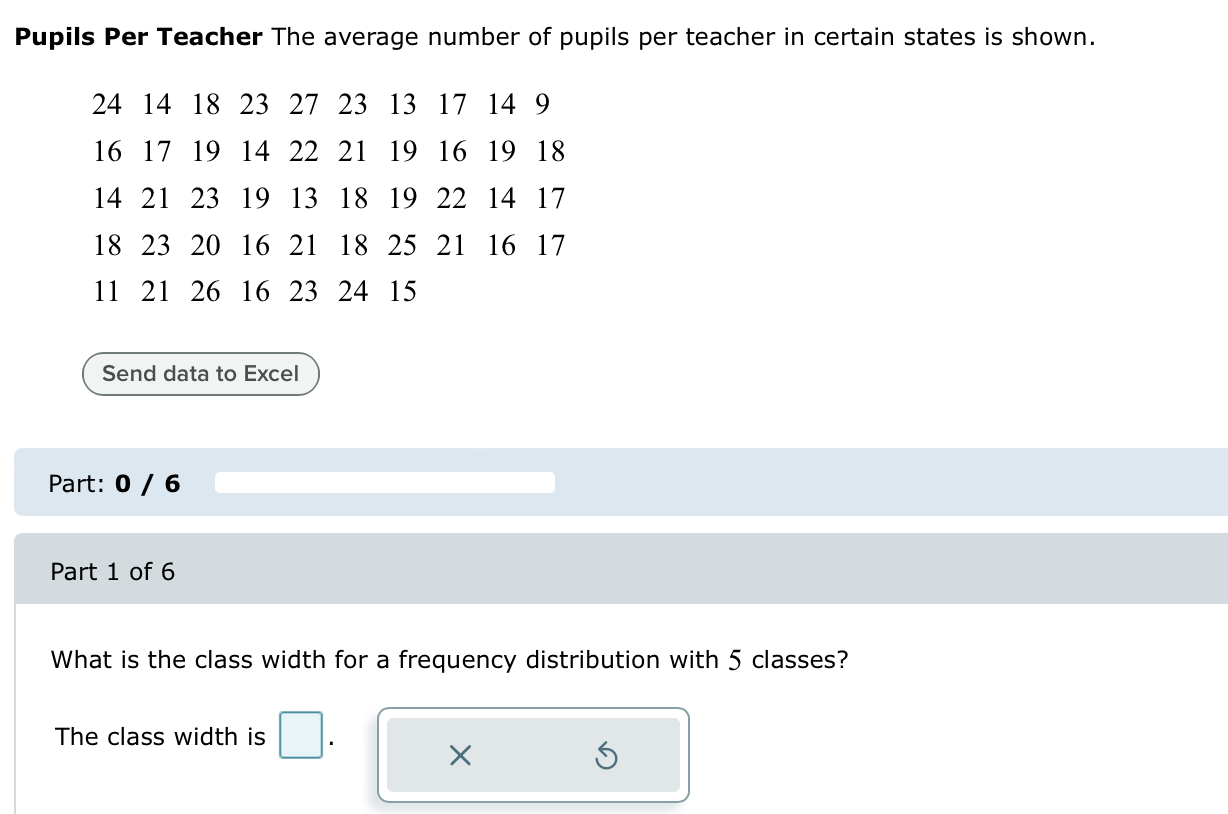
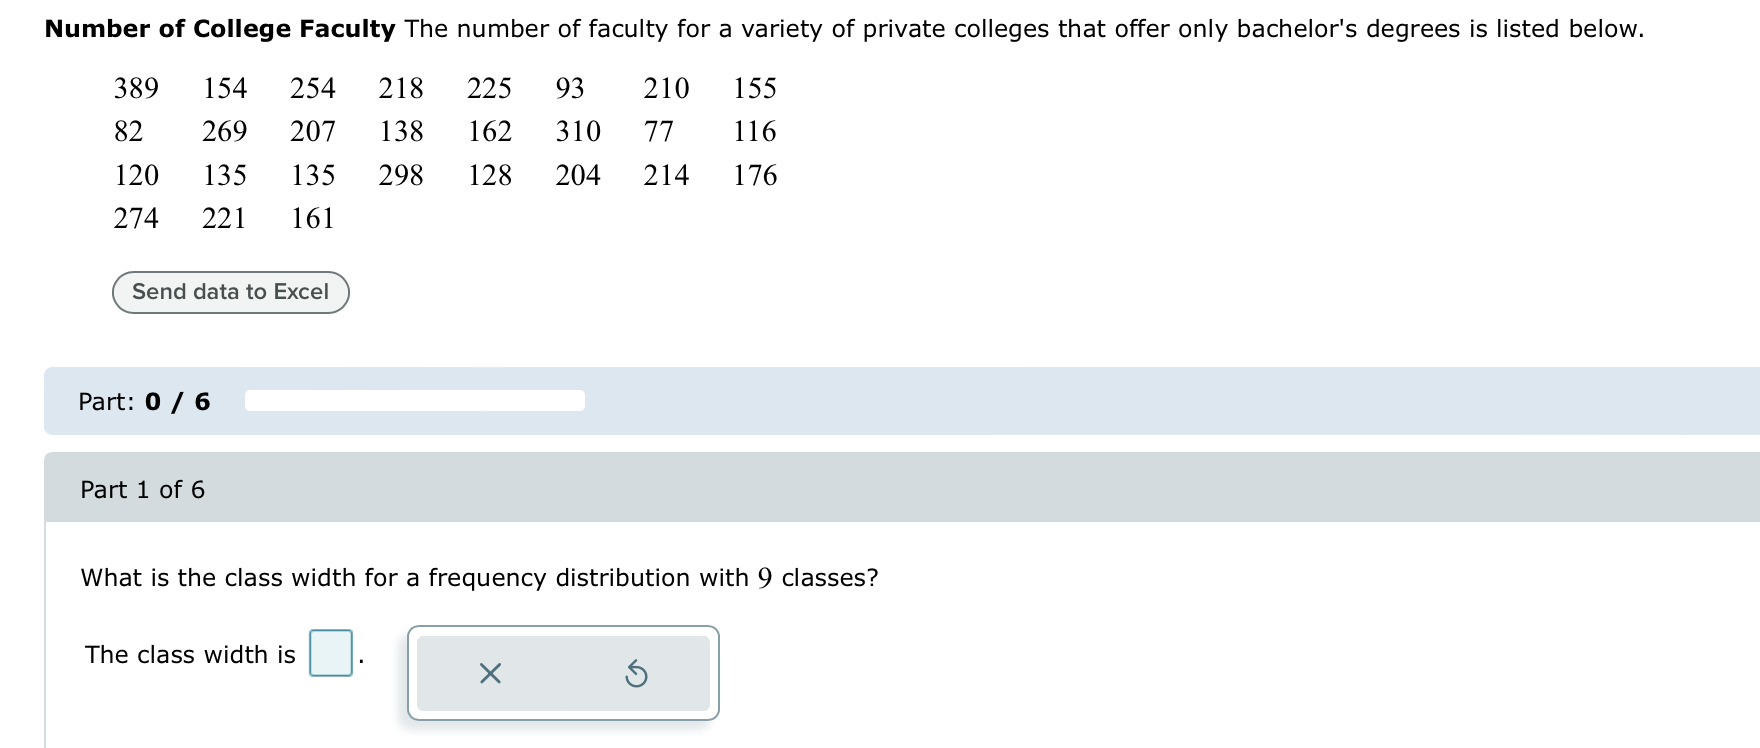
Here are three histograms. Histogram A Histogram B Histogram C 60 60 60 50 50 50 40 40 40 30 30 30 20 20 20 10 10 10 0 0 0 0 2 4 6 8 10121416 18 2022 24 02 4 6 810121416 182022 24 0 2 4 6 8 1012141618 2022 24 (a) Which histogram is best described as unimodal? )4 S Histogram A Histogram B Histogram C (b) Which histogram is skewed to the right the most? Histogram A Histogram B Histogram C (c) Which histogram is the closest to being uniform? Histogram A Histogram B Histogram C (d) Which histogram is the closest to being symmetric? Histogram A Histogram B Histogram C Pupils Per Teacher The average number of pupils per teacher in certain states is shown. 24 14 18 23 27 23 13 17 14 9 16 17 19 14 22 21 19 16 19 18 14 21 23 19 13 18 19 22 14 17 18 23 20 16 21 18 25 21 16 17 11 21 26 16 23 24 15 Send data to Excel Part: 0 / 6 Part 1 of 6 What is the class width for a frequency distribution with 5 classes? The class width is ' ' )' X S Number of College Faculty The number of faculty for a variety of private colleges that offer only bachelor's degrees is listed below. 380 154 254 218 225 93 210 155 82 269 207 138 162 310 77 116 120 135 135 298 128 204 214 176 274 221 161 Send data to Excel Part: 0 / 6 Part 1 of 6 What is the class width for a frequency distribution with 9 classes? The class width is ' ' " hTe S
Step by Step Solution
There are 3 Steps involved in it

Get step-by-step solutions from verified subject matter experts