

Question: (6) Hypothesis Test for One Population Proportion In 2012, it was reported that $7.3% = .573 of American households regularly watch major league baseball on

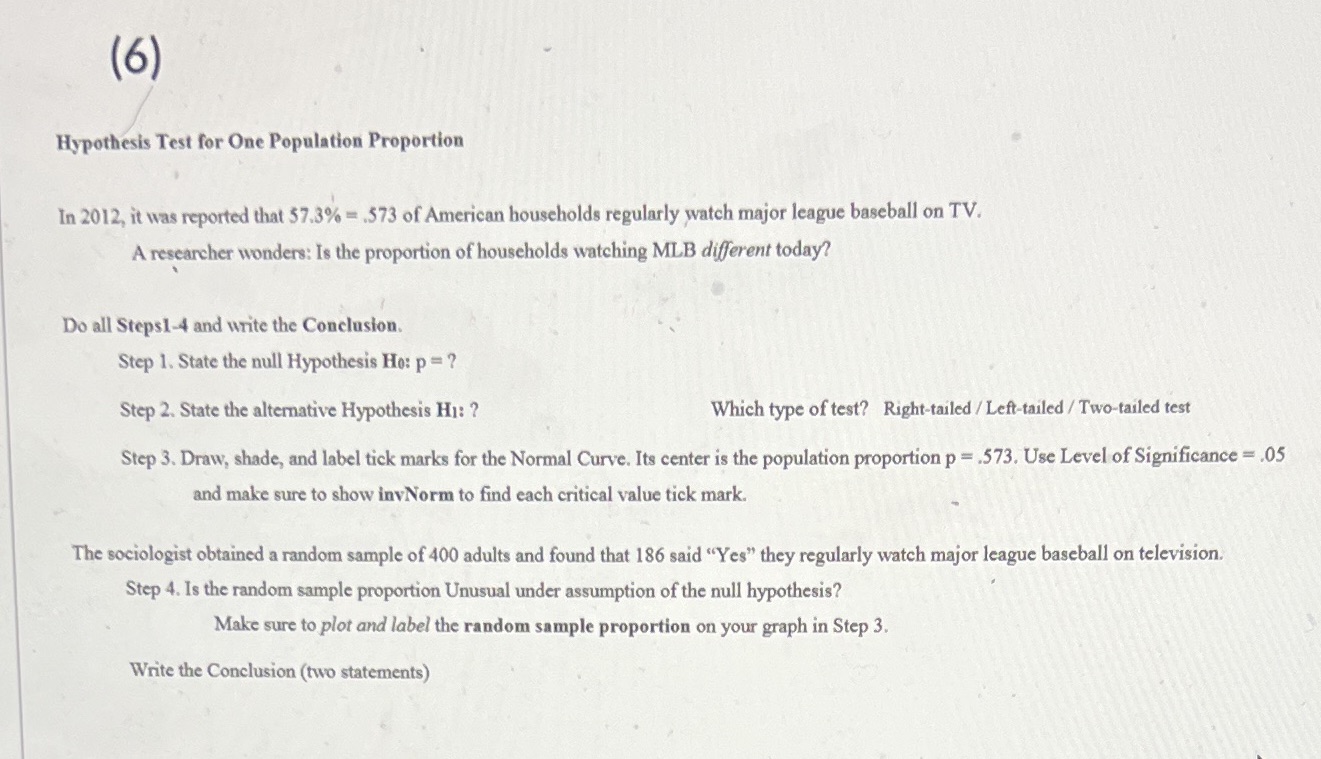
(6) Hypothesis Test for One Population Proportion In 2012, it was reported that $7.3% = .573 of American households regularly watch major league baseball on TV. A researcher wonders: Is the proportion of households watching MLB different today? Do all Steps1-4 and write the Conclusion. Step 1. State the null Hypothesis Ho: p = ? Step 2. State the alternative Hypothesis H1: ? Which type of test? Right-tailed / Left-tailed / Two-tailed test Step 3. Draw, shade, and label tick marks for the Normal Curve. Its center is the population proportion p = .573. Use Level of Significance = .05 and make sure to show invNorm to find each critical value tick mark. The sociologist obtained a random sample of 400 adults and found that 186 said "Yes" they regularly watch major league baseball on television. Step 4. Is the random sample proportion Unusual under assumption of the null hypothesis? Make sure to plot and label the random sample proportion on your graph in Step 3. Write the Conclusion (two statements)
Step by Step Solution
There are 3 Steps involved in it

Get step-by-step solutions from verified subject matter experts