

Question: 6. In the HSB data set, compare the standardized reading scores to the standardized math scores, i.e., test the null hypothesis that there is no
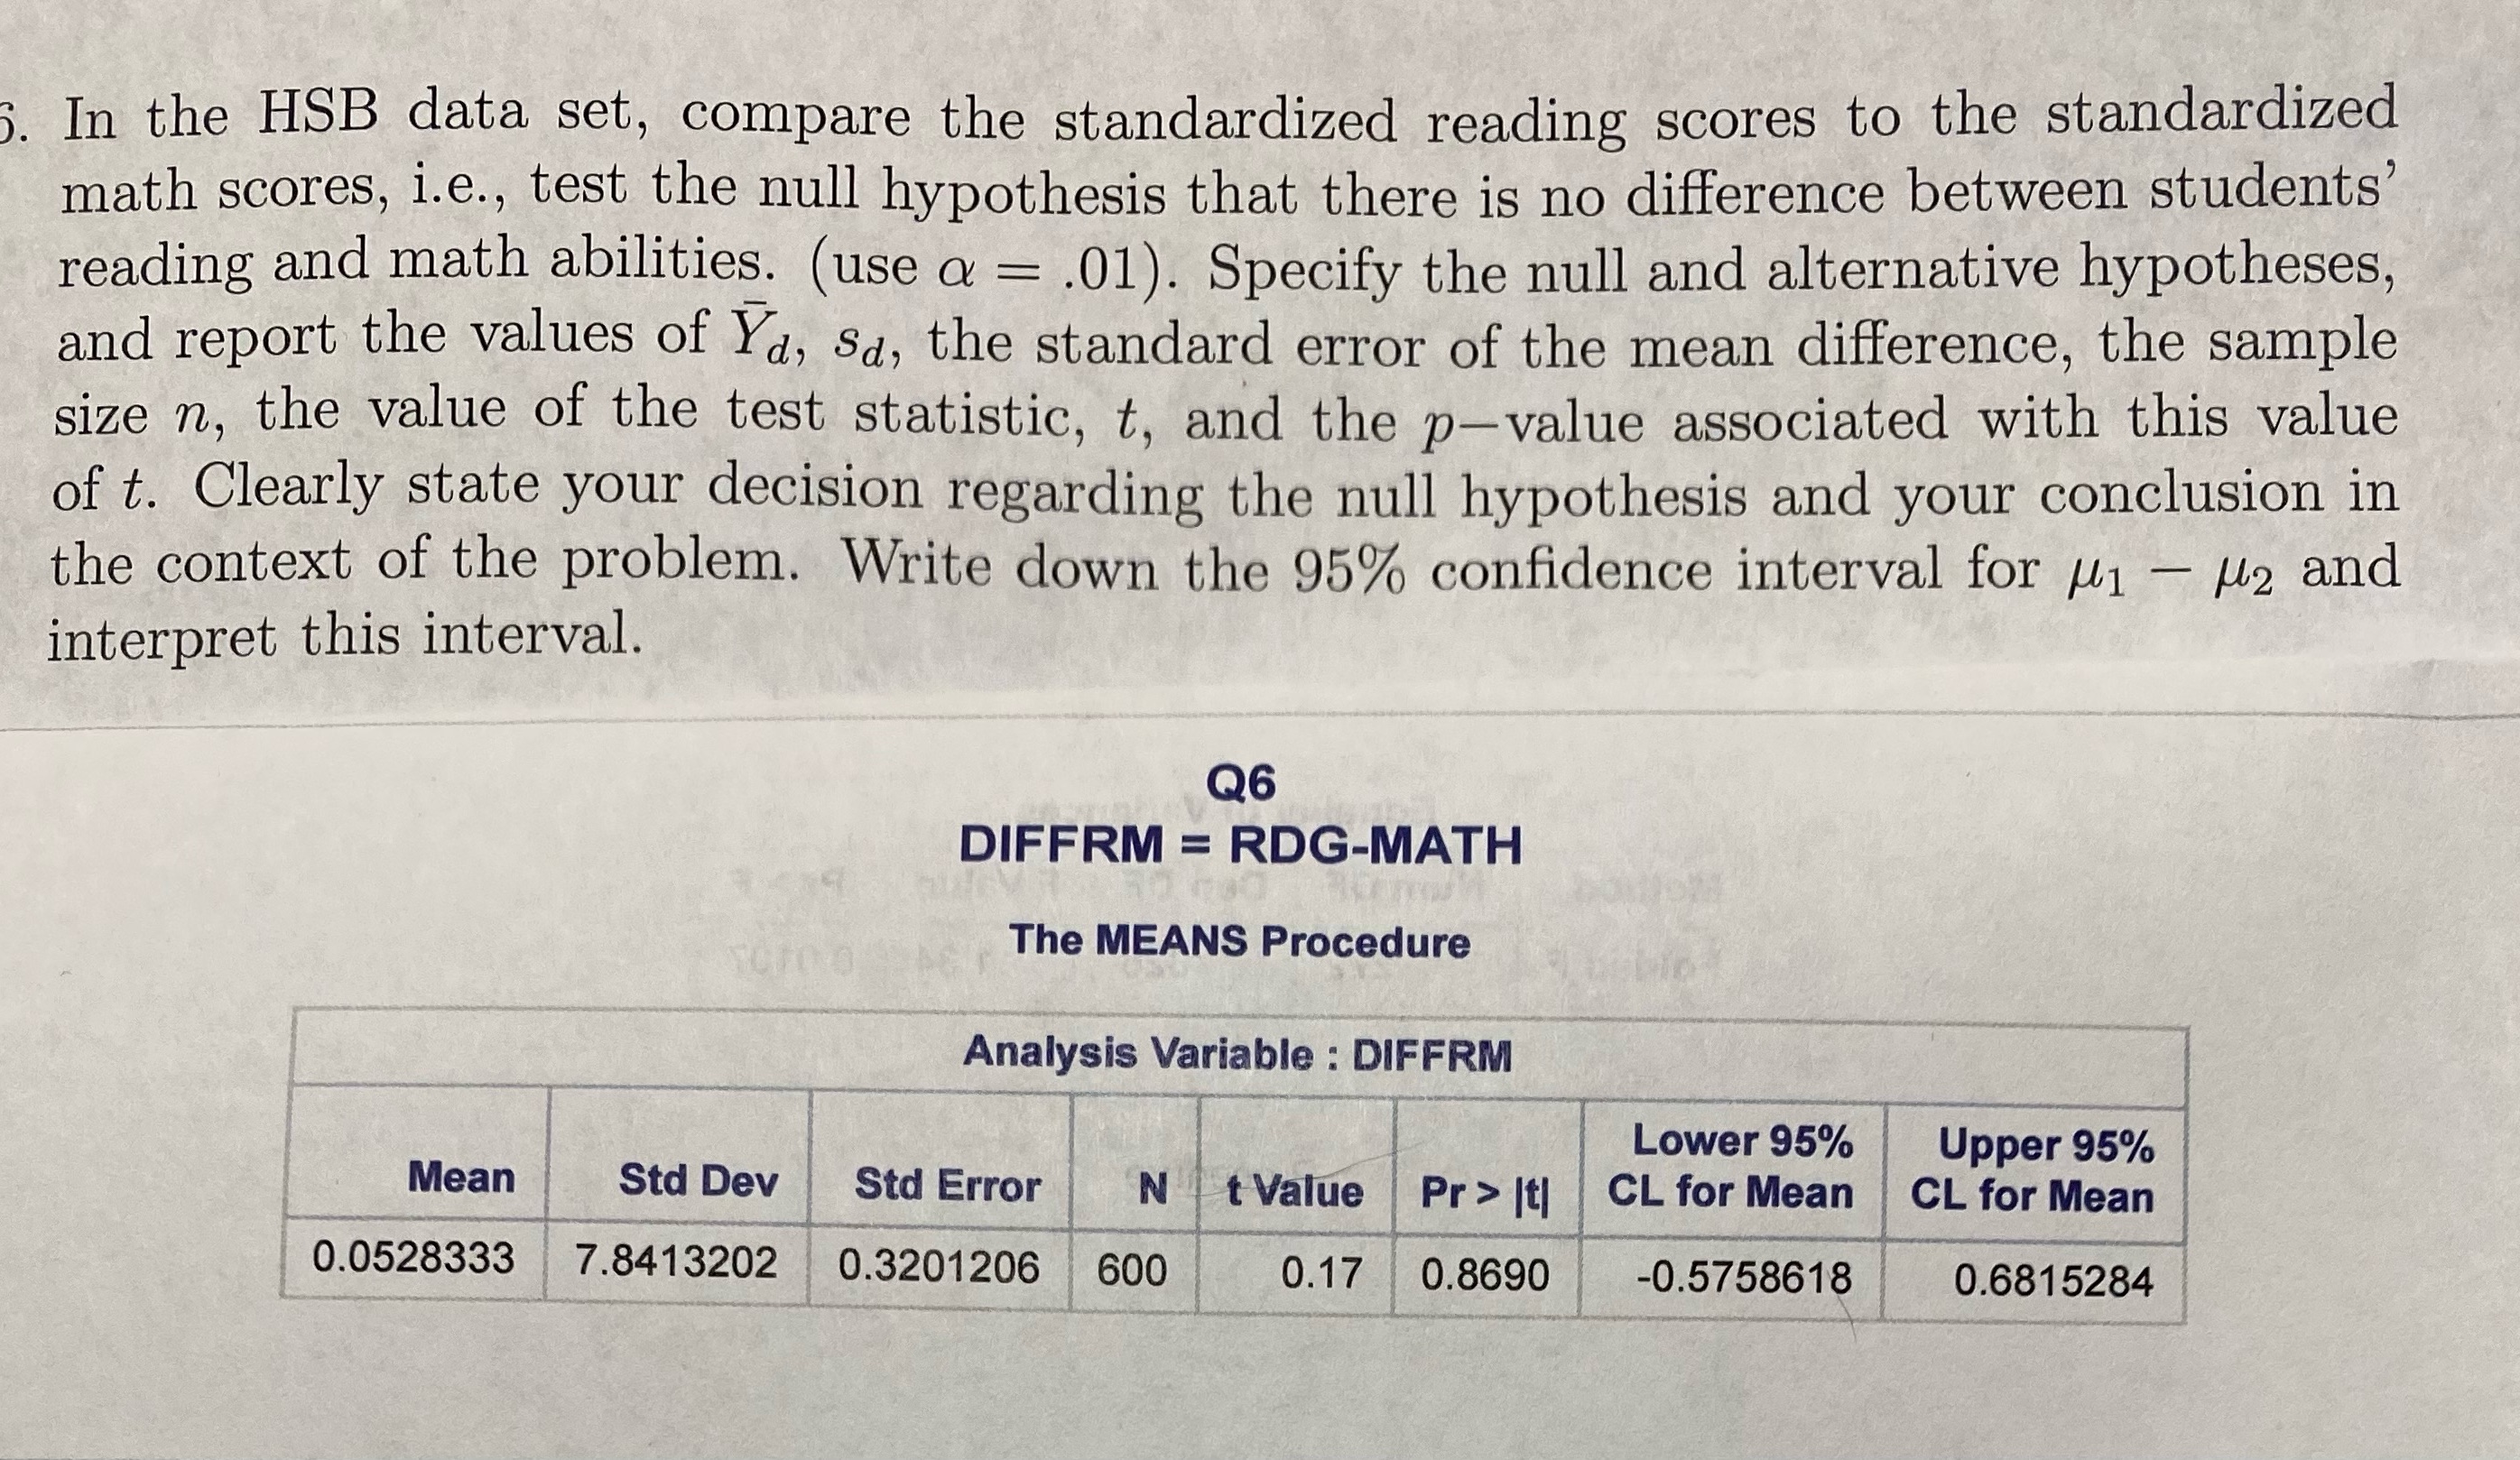
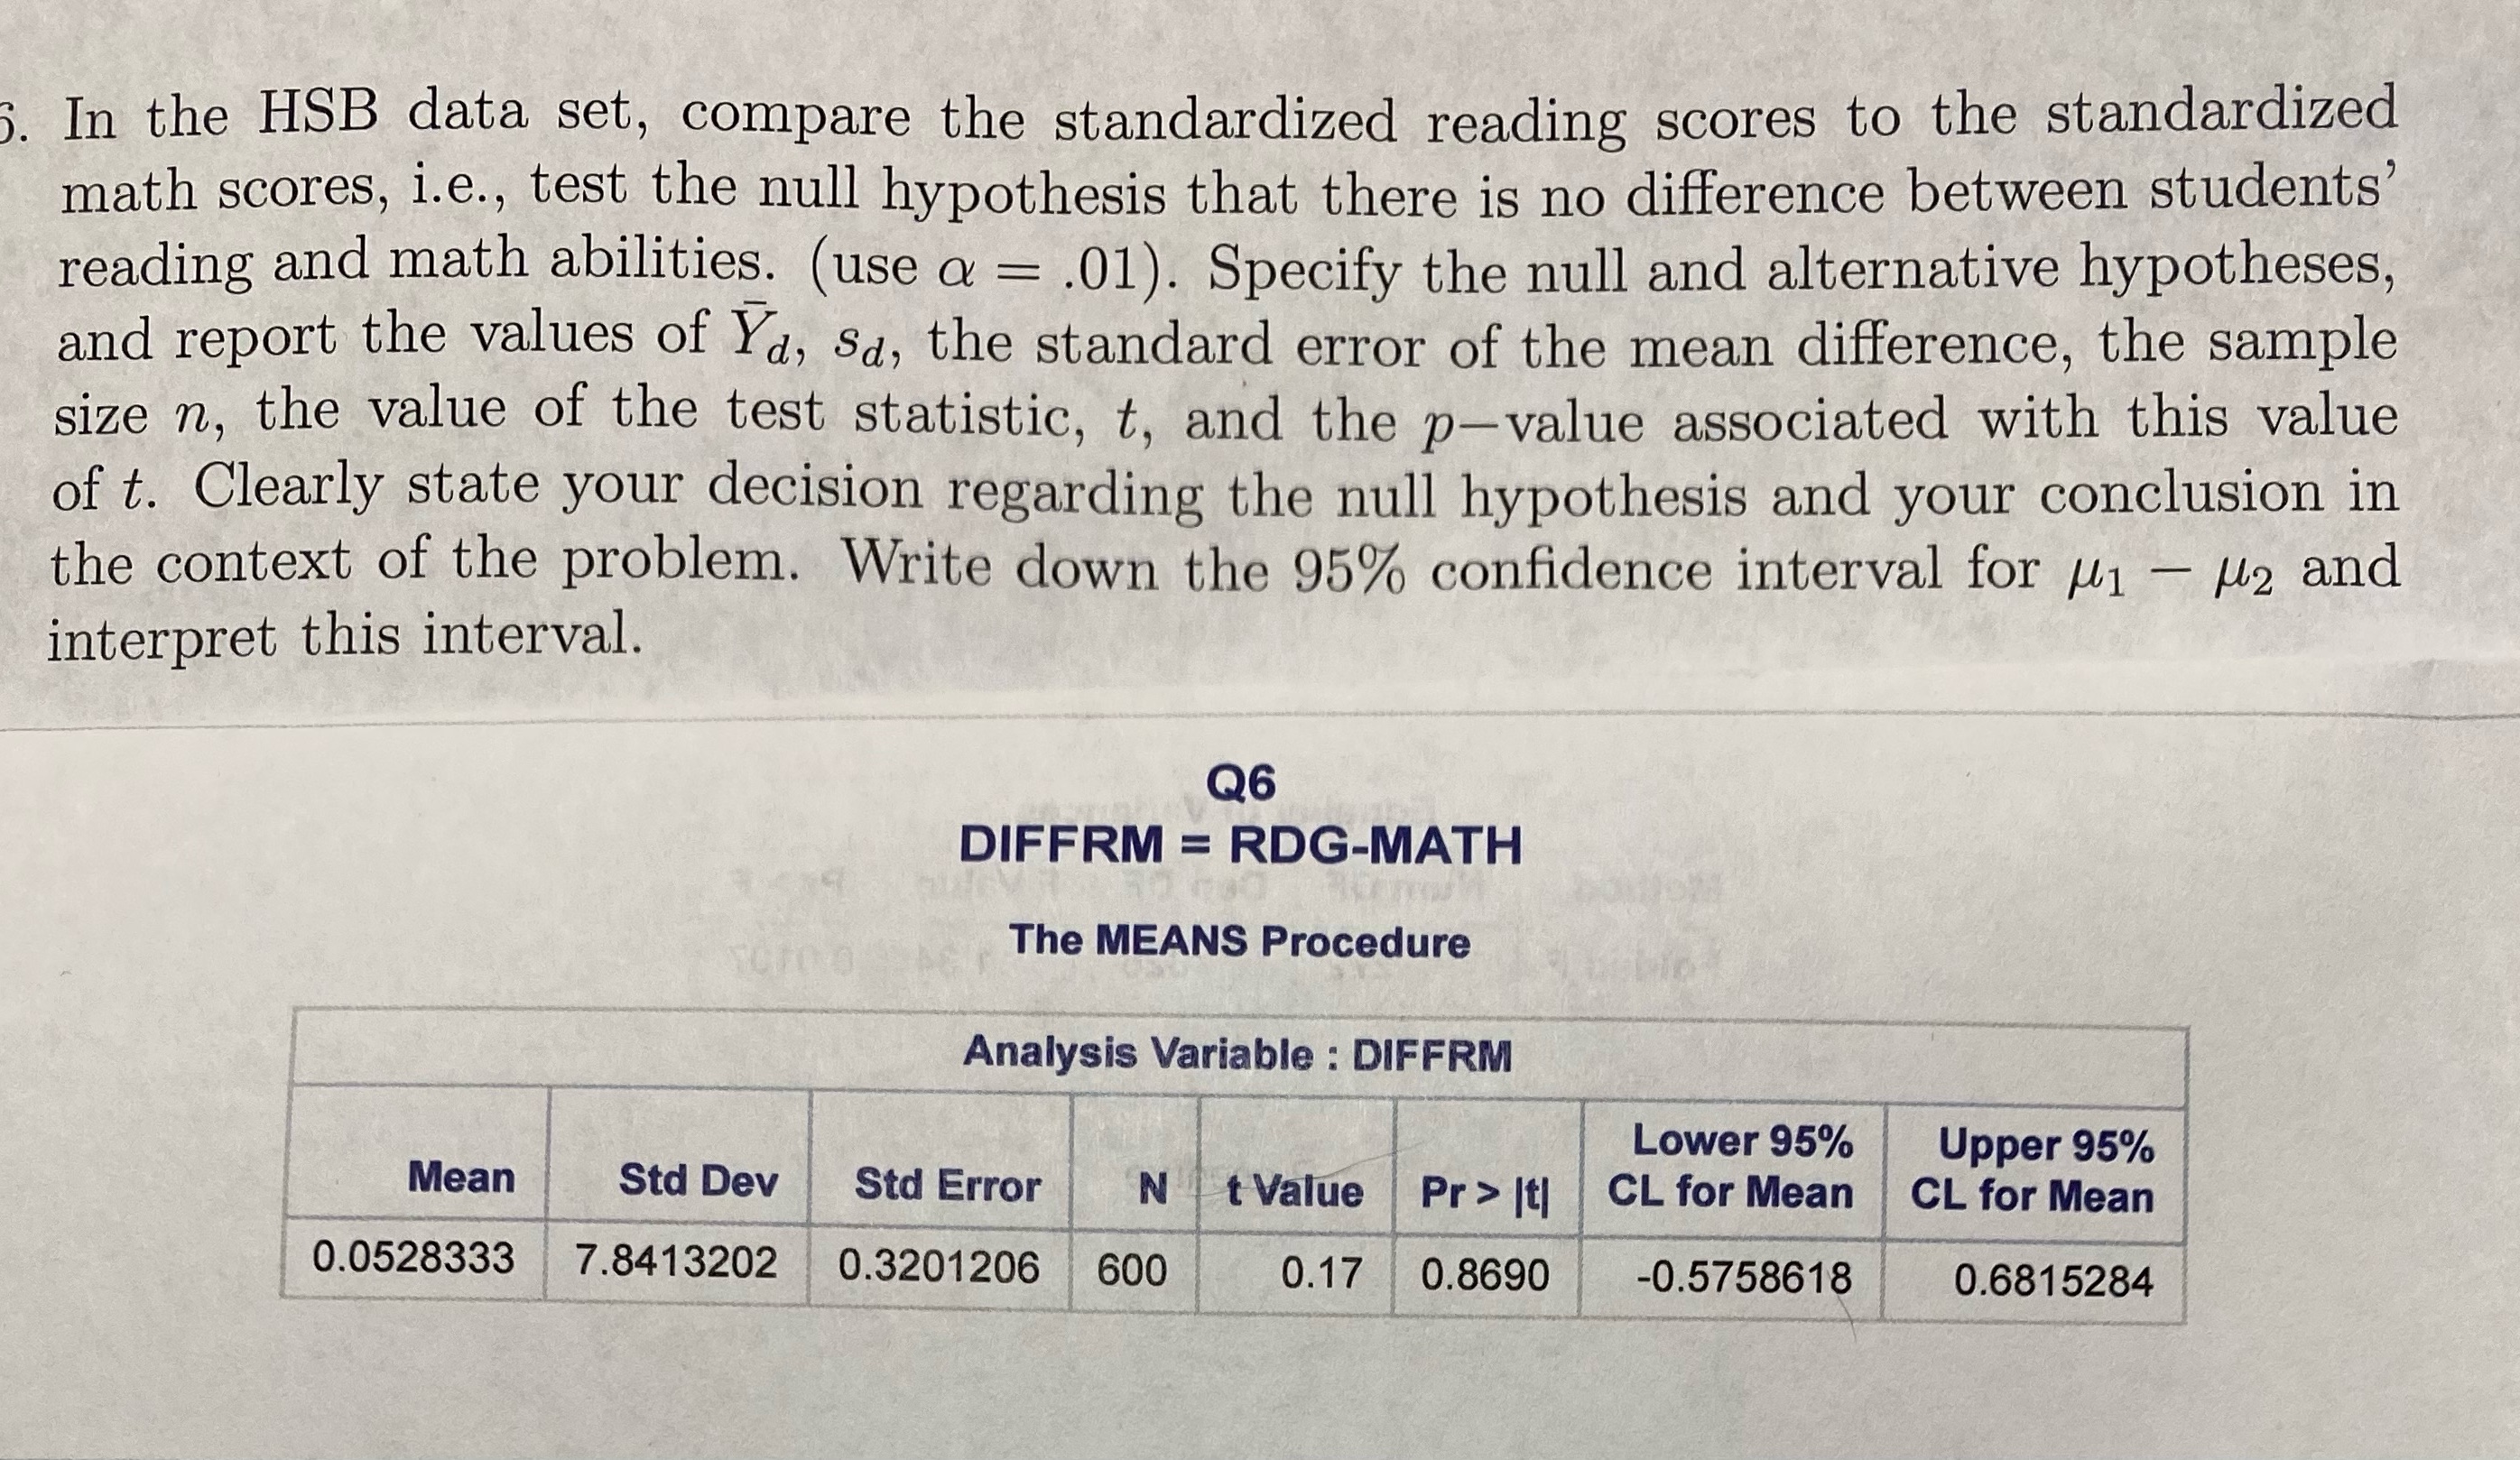
6. In the HSB data set, compare the standardized reading scores to the standardized math scores, i.e., test the null hypothesis that there is no difference between students' reading and math abilities. (use a = .01). Specify the null and alternative hypotheses, and report the values of Ya, sa, the standard error of the mean difference, the sample size n, the value of the test statistic, t, and the p-value associated with this value of t. Clearly state your decision regarding the null hypothesis and your conclusion in the context of the problem. Write down the 95% confidence interval for M1 - M2 and interpret this interval. Q6 DIFFRM = RDG-MATH The MEANS Procedure Analysis Variable : DIFFRM Lower 95% Upper 95% Mean Std Dev Std Error N t Value Pr > It CL for Mean CL for Mean 0.0528333 7.8413202 0.3201206 600 0.17 0.8690 -0.5758618 0.6815284
Step by Step Solution
There are 3 Steps involved in it

Get step-by-step solutions from verified subject matter experts