

Question: 6. Interpret the correlations below (main effects and intercorrelations) Correlations Exposure COMPUTE Seriousness_Exposure Exposure=Q4 Seriousness_general COMPUTE + Q6 + Q8 + Fearofcrime COMPUTE Seriousness=Q5r +
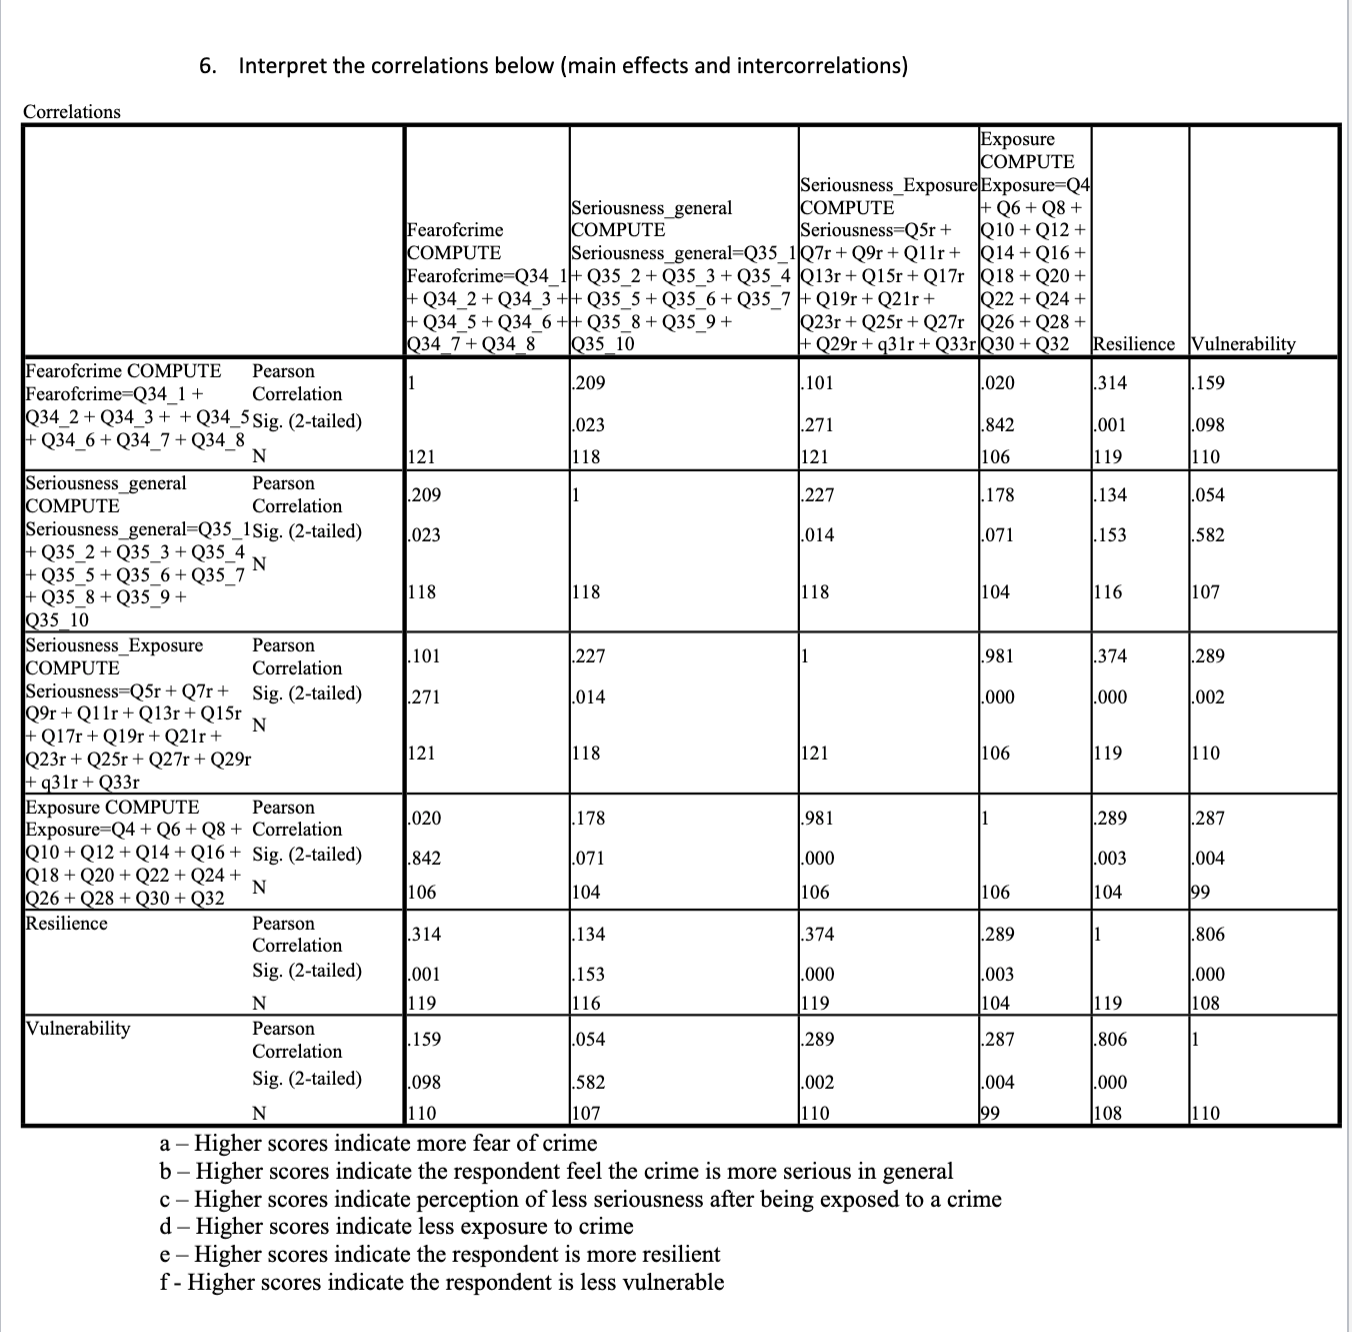
6. Interpret the correlations below (main effects and intercorrelations) Correlations Exposure COMPUTE Seriousness_Exposure Exposure=Q4 Seriousness_general COMPUTE + Q6 + Q8 + Fearofcrime COMPUTE Seriousness=Q5r + Q10 + Q12 + COMPUTE Seriousness_general=Q35_1 Q7r + Q9r + Q1lr+ Q14+ Q16+ Fearofcrime=Q34 1+ Q35_2 + Q35_3 + Q35_4 Q13r + Q15r + Q17r Q18 + Q20 + + Q34 2 + Q34 3 + + Q35 5+ Q35_6+Q35_7 + Q19r + Q21r+ Q22 + Q24 + + Q34 5+ Q34 6++Q35_8+Q35 9+ Q23r + Q25r + Q27r Q26 + Q28 + Q34 7+ Q34 8 Q35 10 + Q29r + q31r + Q33r Q30 + Q32 Resilience Vulnerability Fearofcrime COMPUTE Pearson .209 020 Fearofcrime=Q34 1 + Correlation 101 314 159 Q34 2 + Q34 3+ + Q34_5 Sig. (2-tailed) 023 842 098 + Q34 6+ Q34_7+ Q34_8 271 001 N 121 118 121 106 1 19 110 Seriousness general Pearson COMPUTE 209 227 178 134 054 Correlation Seriousness_general=Q35_1Sig. (2-tailed) 023 014 071 153 .582 Q35 2+ Q35 3+ Q35_4 N Q35 5+ Q35 6+ Q35 7 Q35 8 + 035 9+ 1 18 118 118 104 116 107 Q35 10 Seriousness_Exposure Pearson .101 .227 .981 COMPUTE .374 289 Correlation Seriousness=Q5r + Q7r+ Sig. (2-tailed) .271 .014 000 .000 .002 Q9r + Q1lr + Q13r+ Q15r N -Q17r+ Q19r+ Q21r+ Q23r + Q25r + Q27r + Q29r 121 1 18 121 106 119 1 10 + q31r + Q33r Exposure COMPUTE Pearson .020 Exposure=Q4 + Q6 + Q8 + Correlation 178 .981 289 .287 Q10 + Q12 + Q14 + Q16 + Sig. (2-tailed) .842 .071 .000 003 .004 Q18 + Q20 + Q22 + Q24+ Q26 + Q28 + Q30 + Q32 N 106 104 106 106 104 99 Resilience Pearson 314 .134 .374 Correlation .289 1.806 Sig. (2-tailed) .001 .153 .000 .003 1.000 N 1 19 116 119 104 119 108 Vulnerability Pearson 159 1.054 289 287 806 Correlation Sig. (2-tailed) 098 .582 .002 .004 .000 110 107 110 99 108 110 - Higher scores indicate more fear of crime - Higher scores indicate the respondent feel the crime is more serious in general c - Higher scores indicate perception of less seriousness after being exposed to a crime 1 - Higher scores indicate less exposure to crime e - Higher scores indicate the respondent is more resilient f - Higher scores indicate the respondent is less vulnerable
Step by Step Solution
There are 3 Steps involved in it

Get step-by-step solutions from verified subject matter experts