

Question: 6. Is the graph below a good graph or a bad graph? Justify your answer. Total car sales grouped by manufacturers in 1997. Ford 19.4%
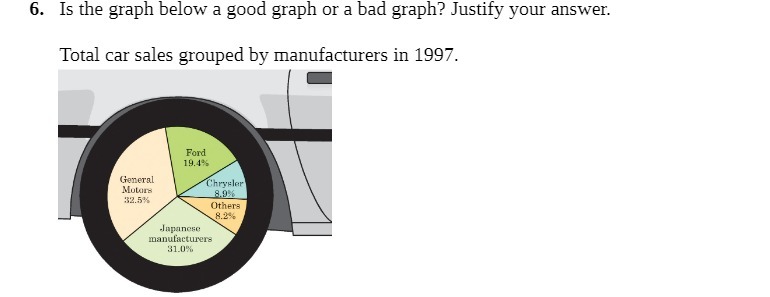
6. Is the graph below a good graph or a bad graph? Justify your answer. Total car sales grouped by manufacturers in 1997. Ford 19.4% General Chrysler Motors 32.5% Others Japanese manufacturers 31.0%%
Step by Step Solution
There are 3 Steps involved in it
1 Expert Approved Answer
Step: 1 Unlock

Question Has Been Solved by an Expert!
Get step-by-step solutions from verified subject matter experts
Step: 2 Unlock
Step: 3 Unlock