

Question: 6) Let's do this equation step by step. A researcher wants to know if chimpanzees mate with more partners than orangutans. They collect observations using
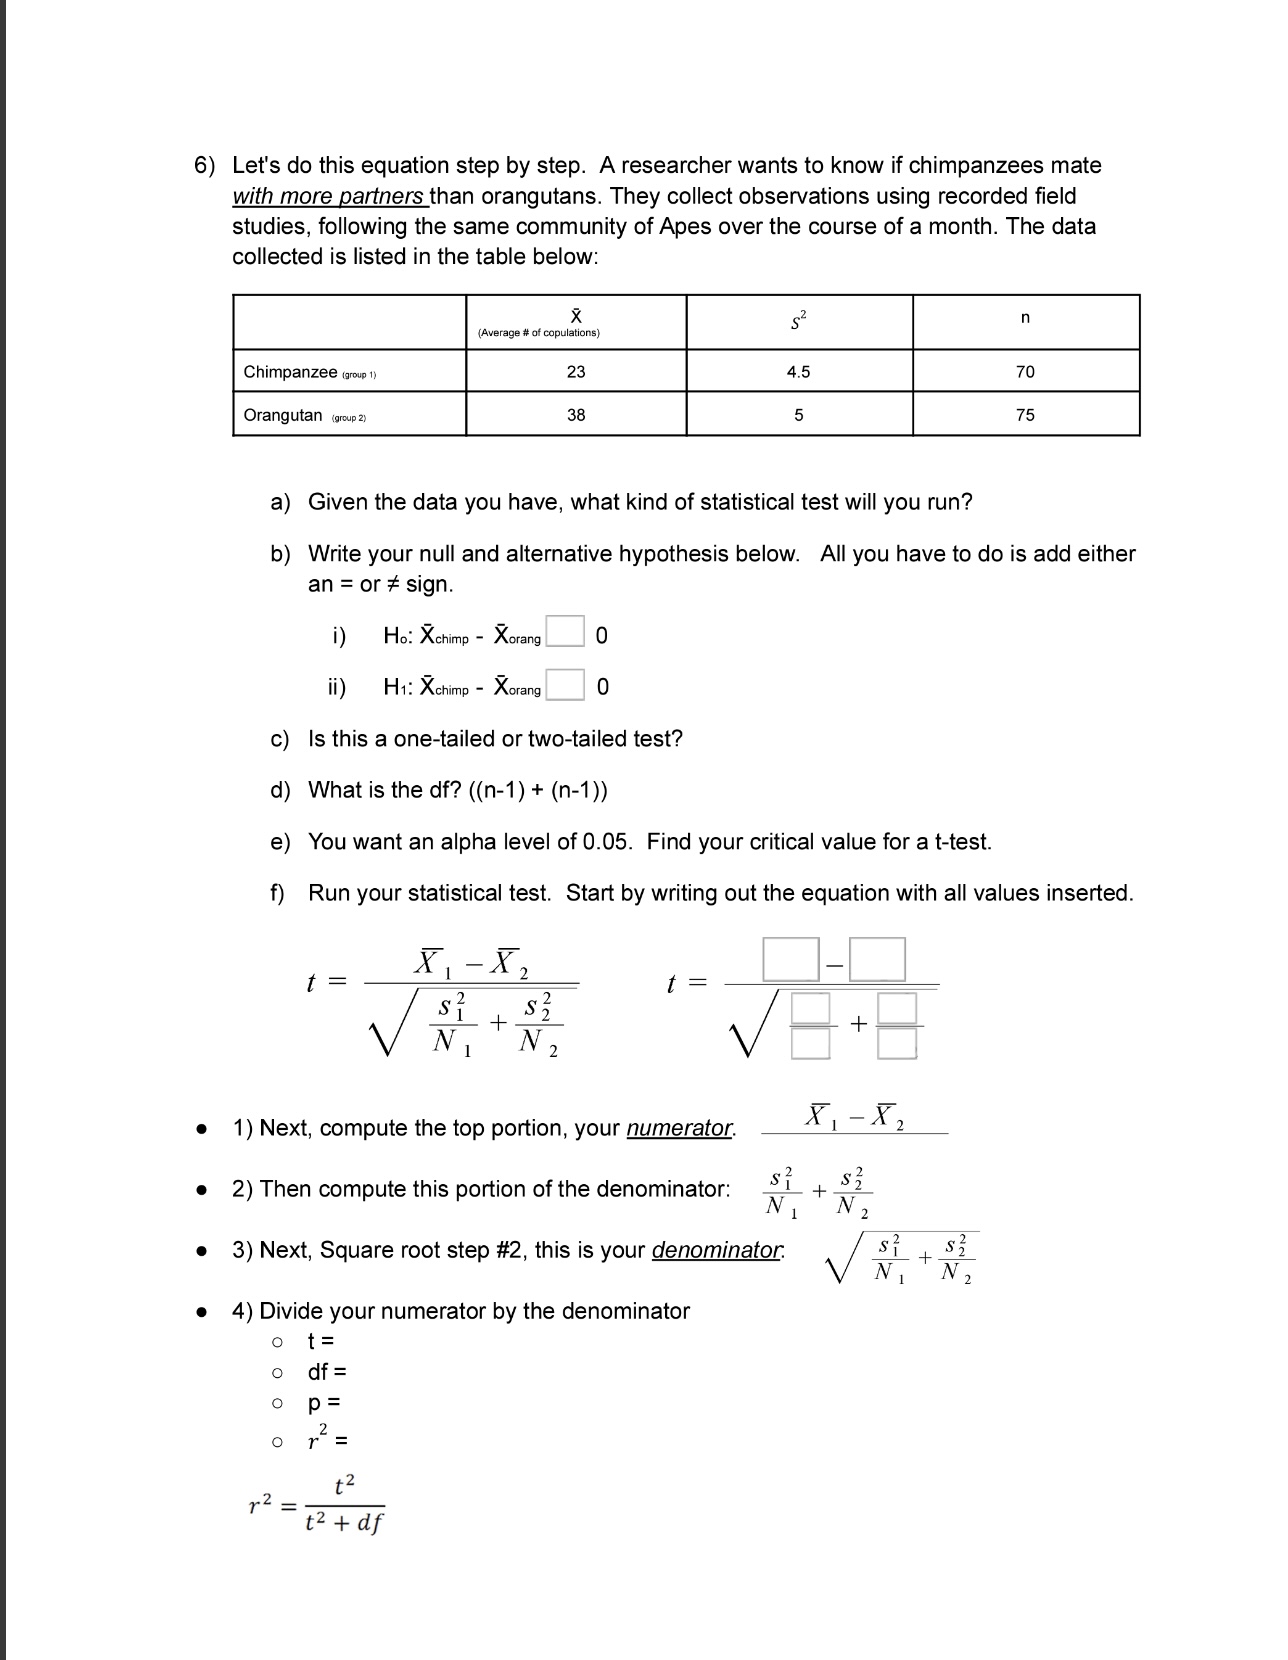
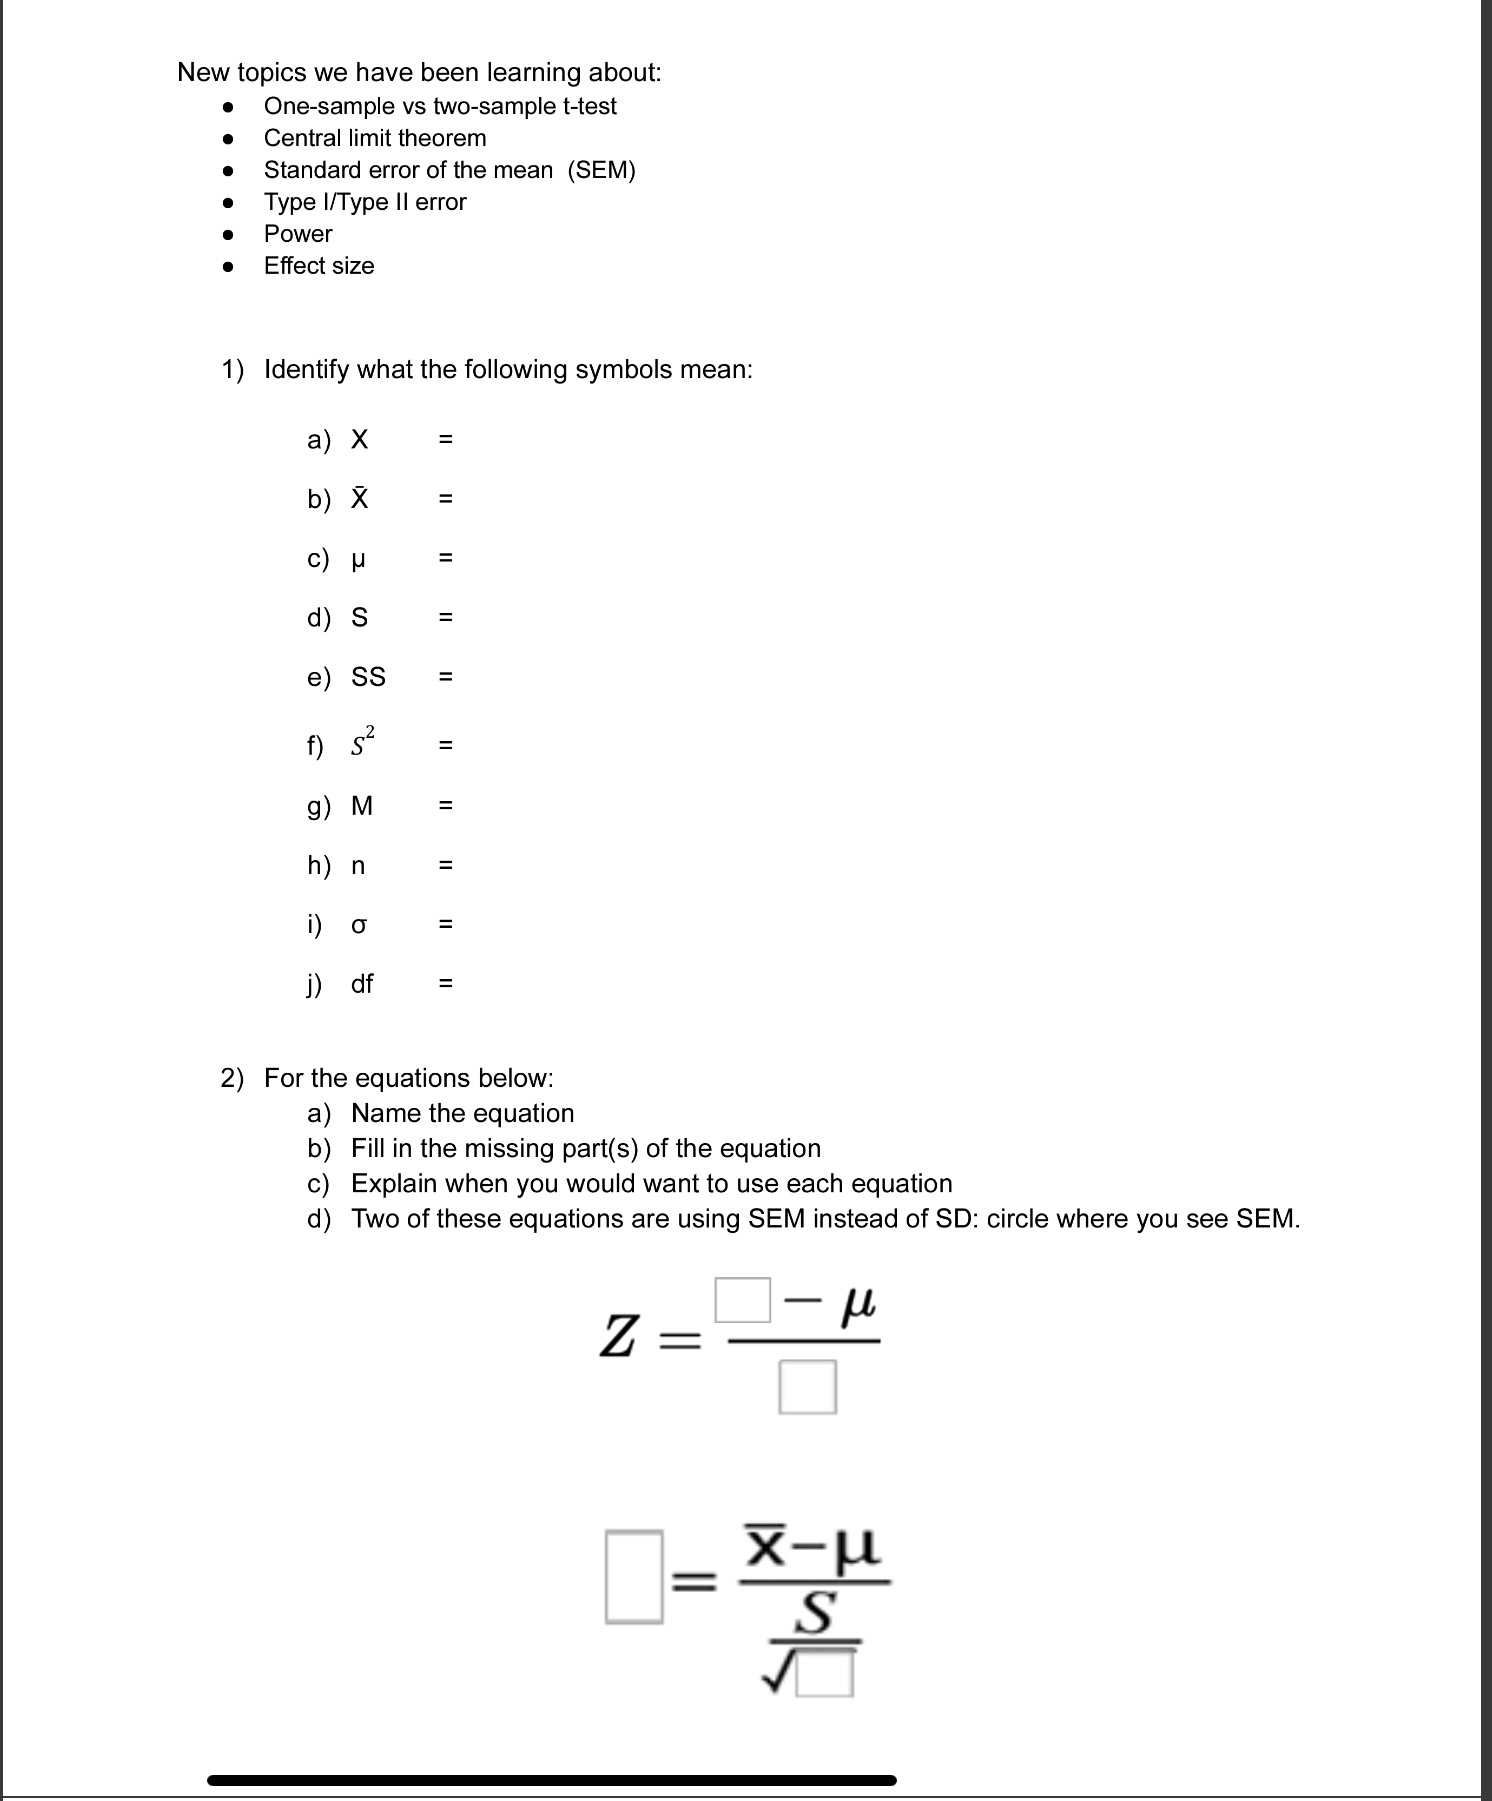
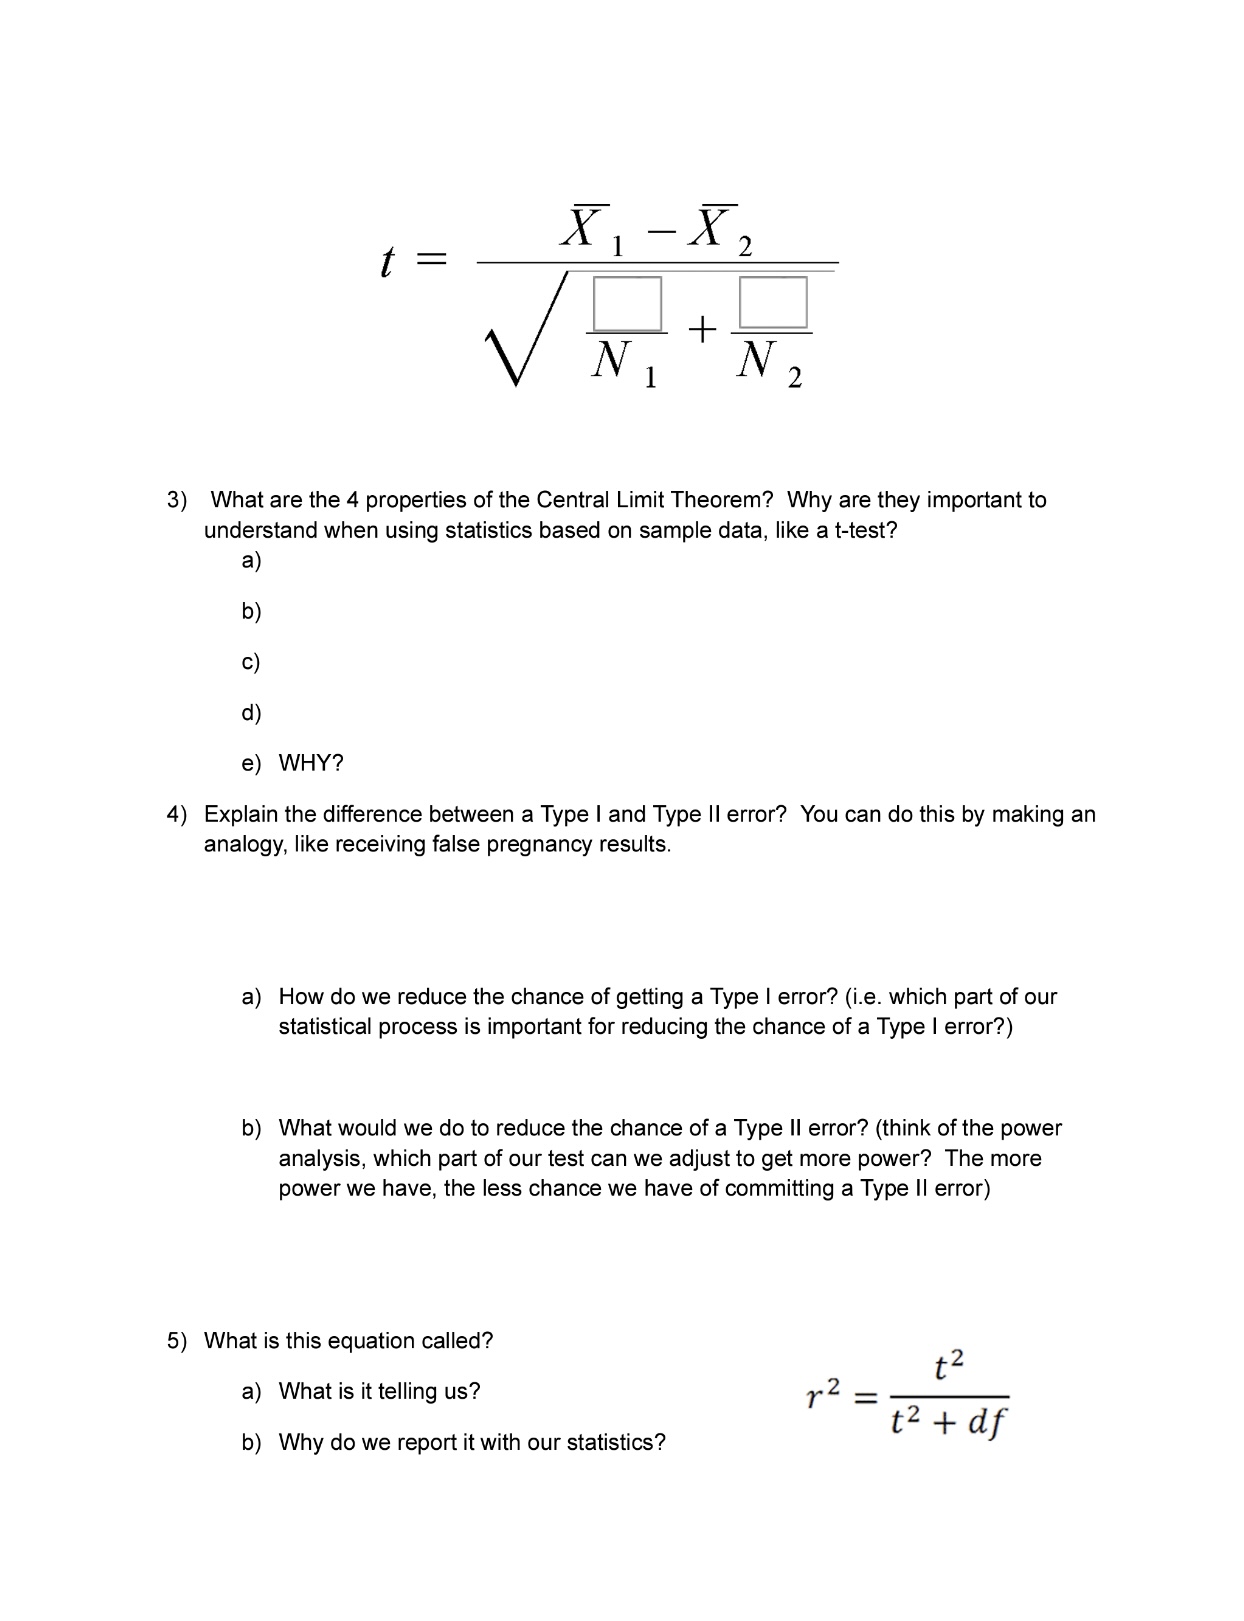
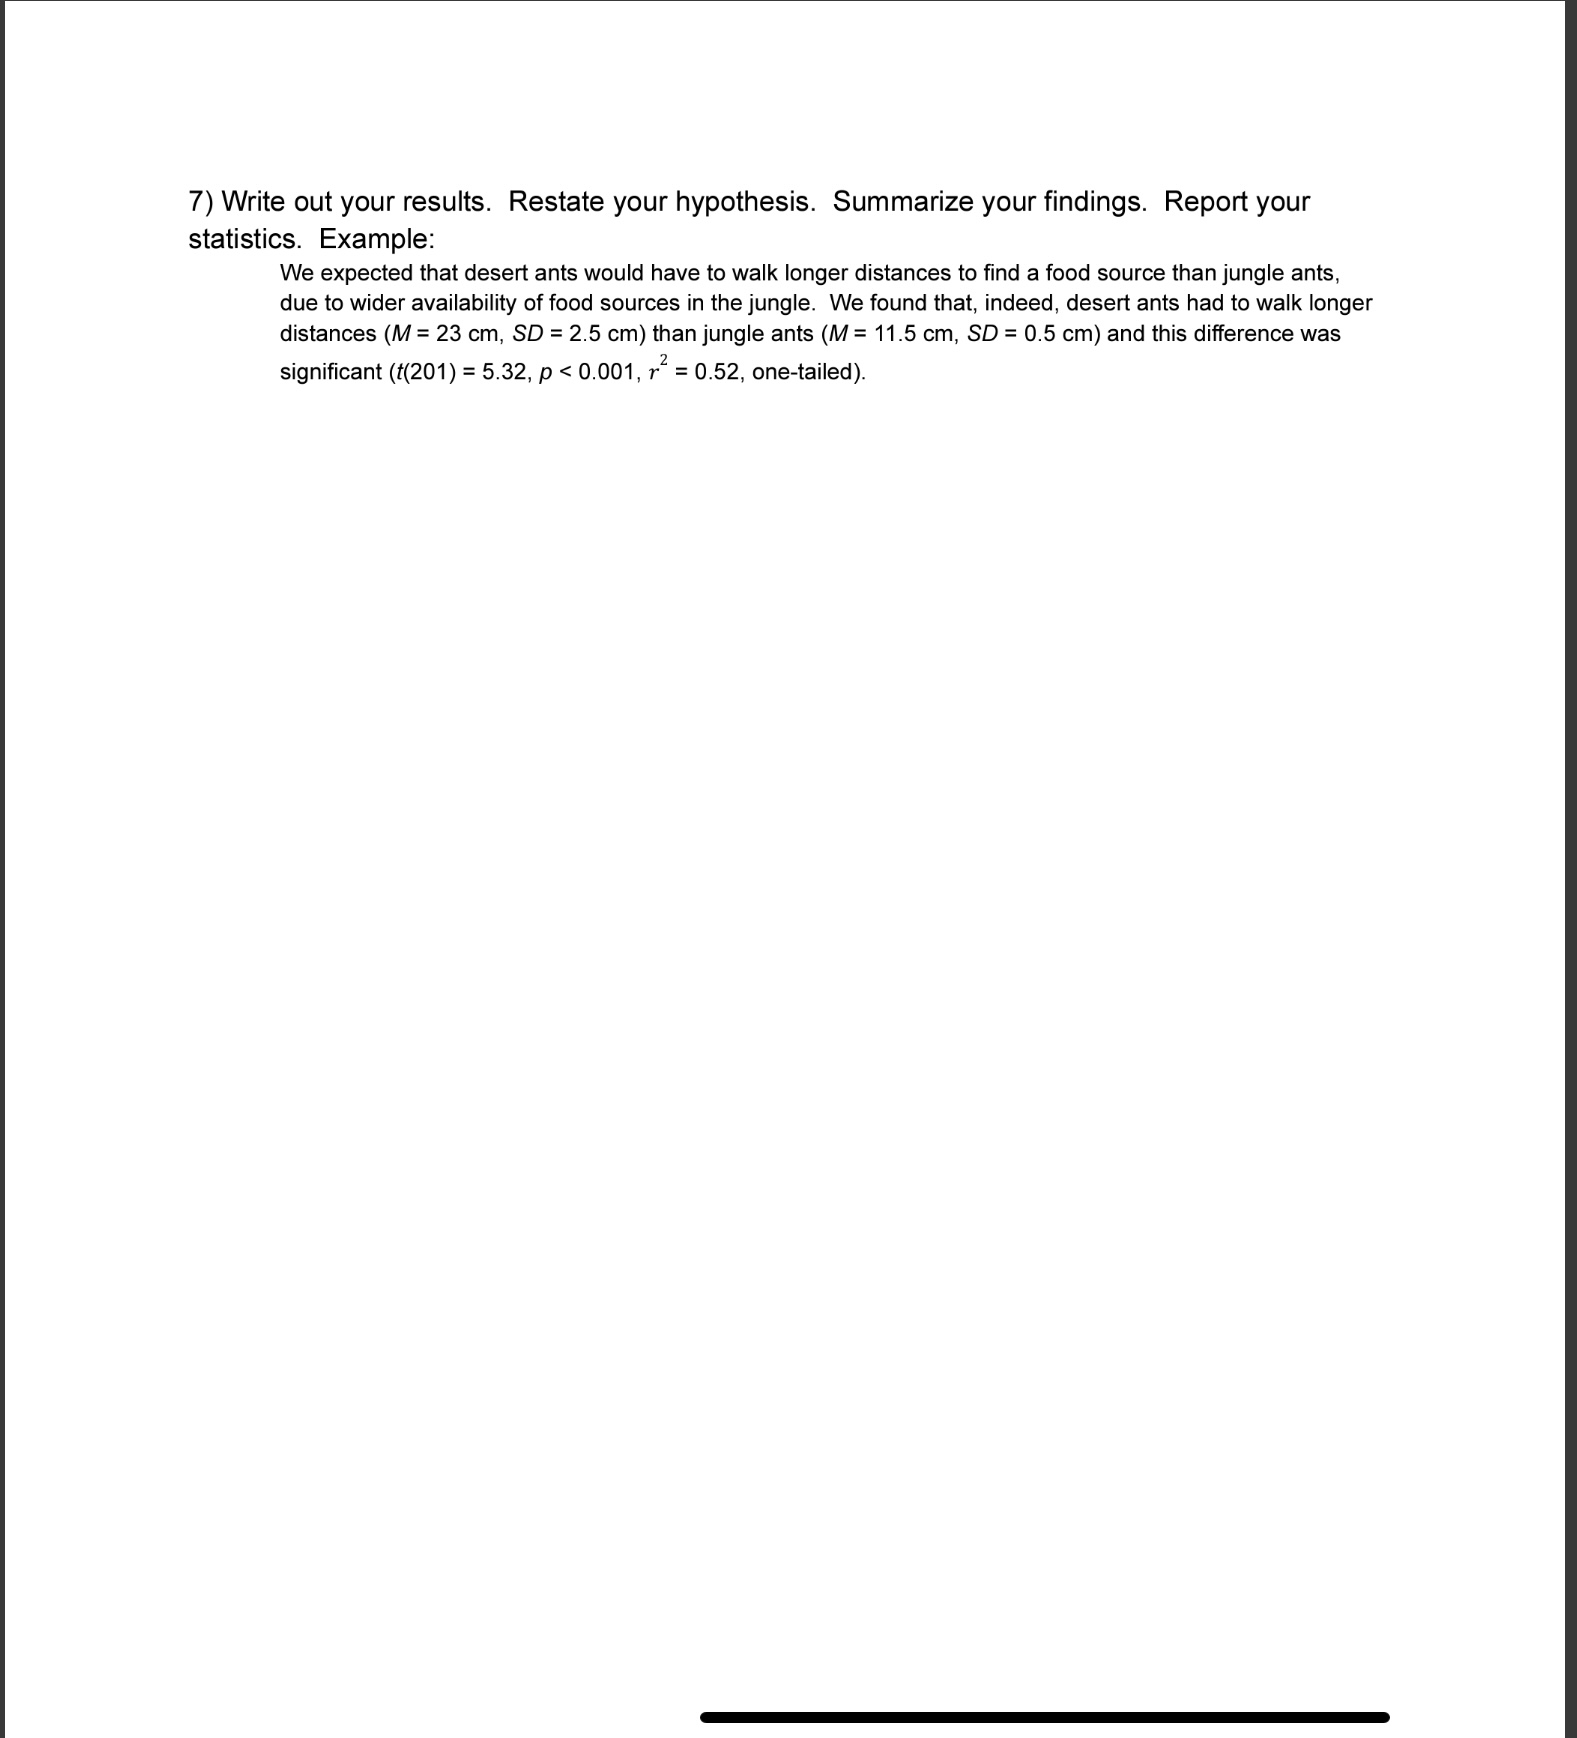
6) Let's do this equation step by step. A researcher wants to know if chimpanzees mate with more partners than orangutans. They collect observations using recorded field studies, following the same community of Apes over the course of a month. The data collected is listed in the table below: _ gy mpu\\atlnns} _ Chimpanzee w1 OranQUtan e ___ a) Given the data you have, what kind of statistical test will you run? b) Write your null and alternative hypothesis below. All you have to do is add either an = or # sign. i) Ho: Xenimp = Xorang 0 i) Ha: Xehimp = Xorang 0 c) Is this a one-tailed or two-tailed test? d) What is the df? ((n-1) + (n-1)) e) You want an alpha level of 0.05. Find your critical value for a t-test. f) Run your statistical test. Start by writing out the equation with all values inserted. X, X, 3' B e & & I = 1J L1 57 Si 82 + == =+ = N, N, \\/ o 1) Next, compute the top portion, your numerator. X, - X, 2 2 e 2) Then compute this portion of the denominator: :{1 -+ ;{2 : =i I 2 e 3) Next, Square root step #2, this is your denominator. \\/ i'% 5 ;_}z ' N i3 e 4) Divide your numerator by the denominator o t= o df= o p = New topics we have been learning about: One-sample vs two-sample t-test Central limit theorem . . Standard error of the mean (SEM) Type I/Type II error . . Power Effect size 1) Identify what the following symbols mean: a) X b ) X C ) M d) s 11 e) SS f) 11 g) M h ) n = i) j) df 2) For the equations below: a) Name the equation Fill in the missing part(s) of the equation c) Explain when you would want to use each equation d) Two of these equations are using SEM instead of SD: circle where you see SEM. Z = S> f = 1_X_2 ol e Z = 3) What are the 4 properties of the Central Limit Theorem? Why are they important to understand when using statistics based on sample data, like a t-test? a) b) c) d) e) WHY? 4) Explain the difference between a Type | and Type Il error? You can do this by making an analogy, like receiving false pregnancy results. a) How do we reduce the chance of getting a Type | error? (i.e. which part of our statistical process is important for reducing the chance of a Type | error?) b) What would we do to reduce the chance of a Type Il error? (think of the power analysis, which part of our test can we adjust to get more power? The more power we have, the less chance we have of committing a Type Il error) 5) What is this equation called? t2 T2 +df a) What is it telling us? 2 b) Why do we report it with our statistics? 7) Write out your results. Restate your hypothesis. Summarize your findings. Report your statistics. Example: We expected that desert ants would have to walk longer distances to find a food source than jungle ants, due to wider availability of food sources in the jungle. We found that, indeed, desert ants had to walk longer distances (M = 23 cm, SD = 2.5 cm) than jungle ants (M = 11.5 cm, SD = 0.5 cm) and this difference was significant ((201) = 5.32, p
Step by Step Solution
There are 3 Steps involved in it

Get step-by-step solutions from verified subject matter experts