

Question: 6 . Marginal analysis and efficiency The following graph shows the market demand and supply curves for T-shirts that are sold in a perfectly competitive
6 . Marginal analysis and efficiency The following graph shows the market demand and supply curves for T-shirts that are sold in a perfectly competitive market. Use the graph input tool to help you answer the following questions. You will not be graded on any changes you make to this graph. Note: Once you enter a value in a white field, the graph and any corresponding amounts in each grey field will change accordingly.
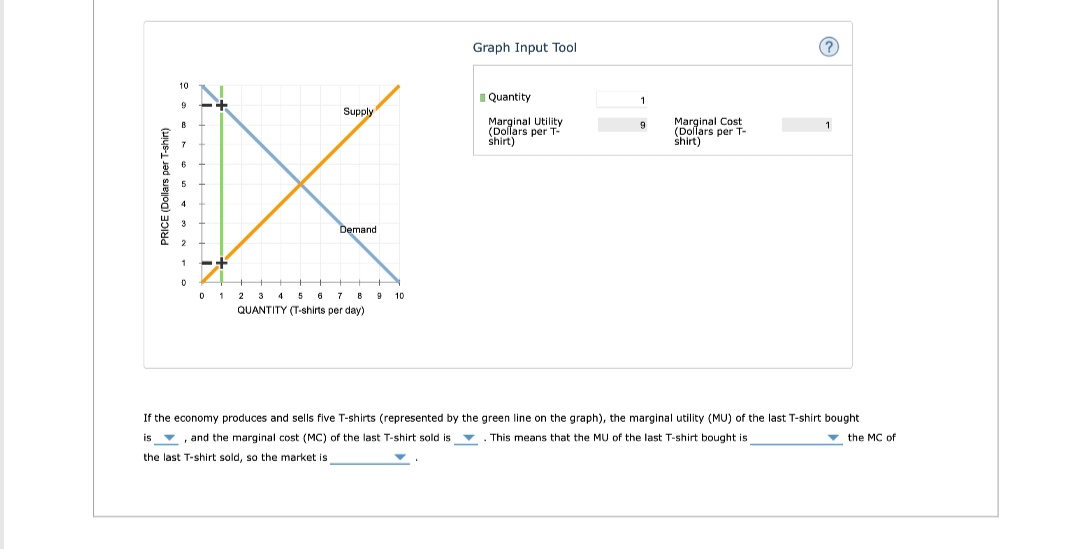
Graph Input Tool (?) 10 Quantity Supply Marginal Utility Marginal Cost (Dollars per T- (Dollars per T- shirt) shirt) PRICE (Dollars per T-shirt) Demand D 1 2 3 4 5 6 7 10 QUANTITY (T-shirts per day) If the economy produces and sells five T-shirts (represented by the green line on the graph), the marginal utility (MU) of the last T-shirt bought is , and the marginal cost (MC) of the last T-shirt sold is * . This means that the MU of the last T-shirt bought is the MC of the last T-shirt sold, so the market is
Step by Step Solution
There are 3 Steps involved in it

Get step-by-step solutions from verified subject matter experts