

Question: 6. Multiple linear regression. This question uses the Year Rain Snow Crest 1997 16.98 109.6 39.57 same data as above, but now as a multiple
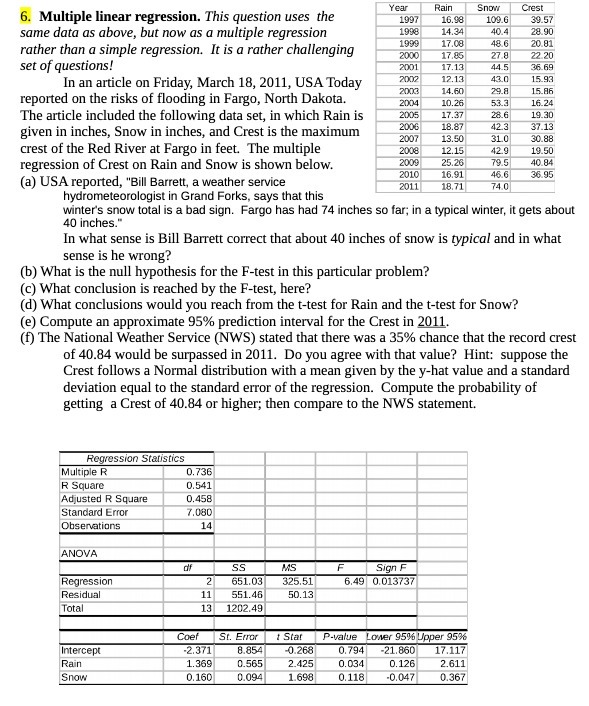
6. Multiple linear regression. This question uses the Year Rain Snow Crest 1997 16.98 109.6 39.57 same data as above, but now as a multiple regression 1998 14.34 40 4 28.90 rather than a simple regression. It is a rather challenging 1990 17.08 48.6 20.81 set of questions! 2000 17.85 27.8 22.20 2001 17.17 44.5 36.69 In an article on Friday, March 18, 2011, USA Today 2007 12.12 43.0 15.93 reported on the risks of flooding in Fargo, North Dakota. 2003 14.60 29.8 15.86 2004 10.26 53.3 16.24 The article included the following data set, in which Rain is 2005 17.37 28.6 19.30 given in inches, Snow in inches, and Crest is the maximum 2006 18.87 42.3 37.13 30.88 crest of the Red River at Fargo in feet. The multiple 2007 13.50 31.0 2008 12.15 42.9 19.50 regression of Crest on Rain and Snow is shown below. 2009 25.26 79.5 40 84 (a) USA reported, "Bill Barrett, a weather service 2010 16.91 46.6 36.95 2011 18.71 74 0 hydrometeorologist in Grand Forks, says that this winter's snow total is a bad sign. Fargo has had 74 inches so far; in a typical winter, it gets about 40 inches." In what sense is Bill Barrett correct that about 40 inches of snow is typical and in what sense is he wrong? (b) What is the null hypothesis for the F-test in this particular problem? (c) What conclusion is reached by the F-test, here? (d) What conclusions would you reach from the t-test for Rain and the t-test for Snow? (e) Compute an approximate 95% prediction interval for the Crest in 2011. (f) The National Weather Service (NWS) stated that there was a 35% chance that the record crest of 40.84 would be surpassed in 2011. Do you agree with that value? Hint: suppose the Crest follows a Normal distribution with a mean given by the y-hat value and a standard deviation equal to the standard error of the regression. Compute the probability of getting a Crest of 40.84 or higher; then compare to the NWS statement. Regression Statistics Multiple R 0.736 R Square 0.541 Adjusted R Square 0.458 Standard Error 7.080 Observations 14 ANOVA off SS MS F Sign F Regression 2 651.03 325.51 6.49 0.013737 Residual 11 551.46 50.13 Total 13 1202.49 Coef St. Error Star P-value Lower 959% Upper 95% Intercept 2.371 8.854 0.268 0.794 -21.860 17.117 Rain 1.369 0.565 2.425 0.034 0.126 2.611 Snow 0.160 0.094 1.696 0.118 -0.047 0.367
Step by Step Solution
There are 3 Steps involved in it

Get step-by-step solutions from verified subject matter experts