

Question: ( 6 Points ) The following table shows per - share price ( P t ) and dividend ( D t ) dynamics of three
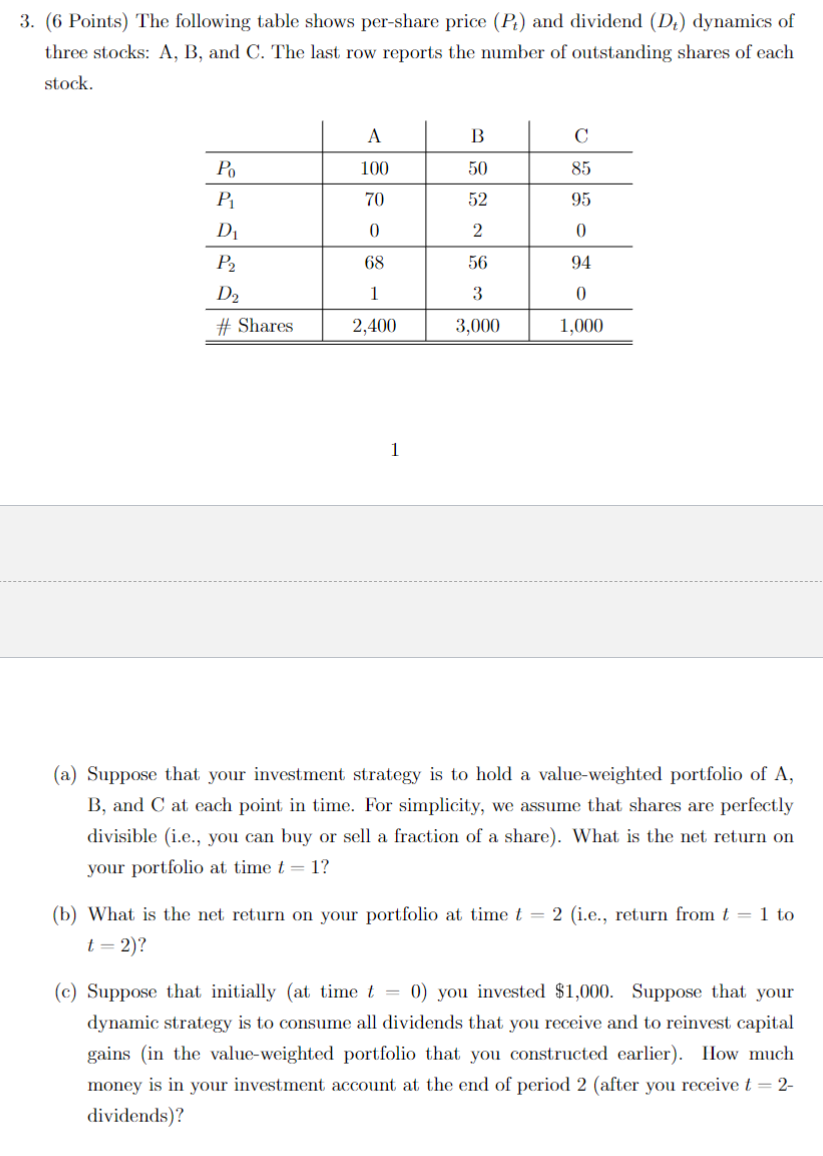
Points The following table shows pershare price and dividend dynamics of
three stocks: A B and C The last row reports the number of outstanding shares of each
stock.
a Suppose that your investment strategy is to hold a valueweighted portfolio of A
B and C at each point in time. For simplicity, we assume that shares are perfectly
divisible ie you can buy or sell a fraction of a share What is the net return on
your portfolio at time
b What is the net return on your portfolio at time ie return from to
c Suppose that initially at time you invested $ Suppose that your
dynamic strategy is to consume all dividends that you receive and to reinvest capital
gains in the valueweighted portfolio that you constructed earlier How much
money is in your investment account at the end of period after you receive
dividends
Step by Step Solution
There are 3 Steps involved in it
1 Expert Approved Answer
Step: 1 Unlock

Question Has Been Solved by an Expert!
Get step-by-step solutions from verified subject matter experts
Step: 2 Unlock
Step: 3 Unlock