

Question: 1: The Systolic Blood Pressure (SBP) of 10 patients in the Framingham Heart Study are given as 141, 119, 122, 127, 125, 123,105,113,106,131. Carry
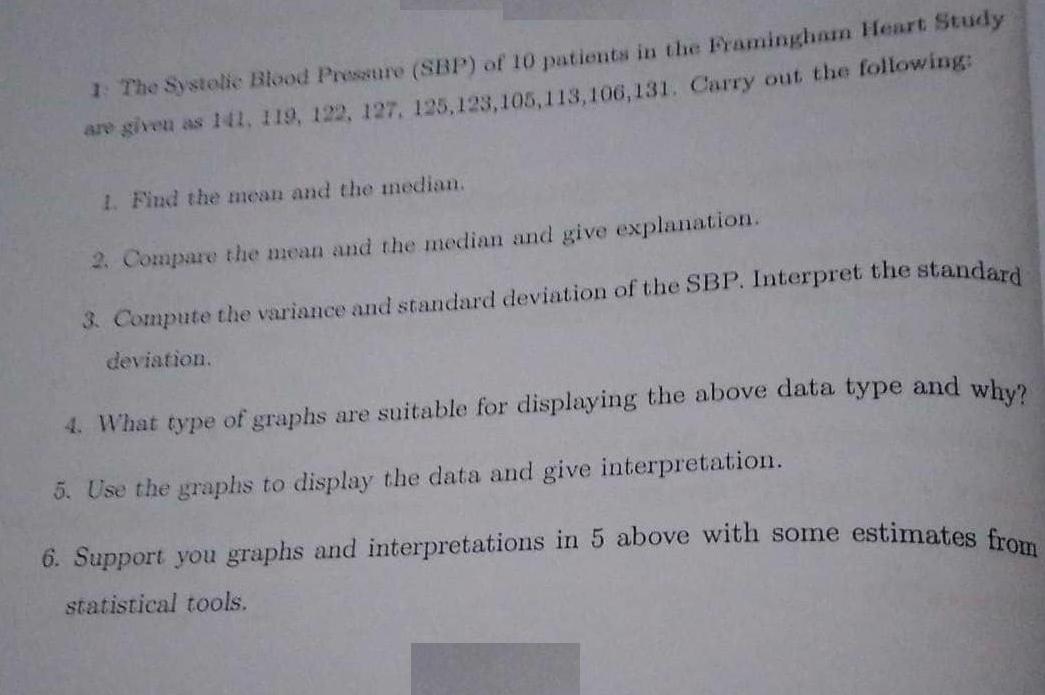
1: The Systolic Blood Pressure (SBP) of 10 patients in the Framingham Heart Study are given as 141, 119, 122, 127, 125, 123,105,113,106,131. Carry out the following: 1. Find the mean and the median. 2. Compare the mean and the median and give explanation. 3. Compute the variance and standard deviation of the SBP. Interpret the standard deviation. 4. What type of graphs are suitable for displaying the above data type and why? 5. Use the graphs to display the data and give interpretation 6. Support you graphs and interpretations in 5 above with some estimates from statistical tools.
Step by Step Solution
3.38 Rating (170 Votes )
There are 3 Steps involved in it
1 Mean and median The mean is the average of all the values in the dataset To calculate the mean we add up all the values and divide by the number of values Mean 141 119 122 127 125 123 105 113 106 13... View full answer

Get step-by-step solutions from verified subject matter experts