

Question: 6. Table 3 is a frequency distribution summarizing the exam grades for a random statistics class. Grade Frequency 49 5-59.5 2 59.5-69 5 3 69
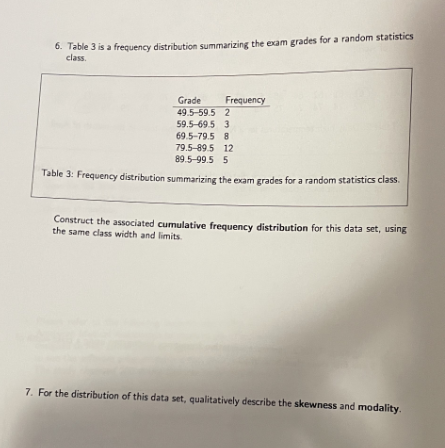
6. Table 3 is a frequency distribution summarizing the exam grades for a random statistics class. Grade Frequency 49 5-59.5 2 59.5-69 5 3 69 5-79.5 8 79.5-89 5 12 89.5-99.5 5 Table 3: Frequency distribution summarizing the exam grades for a random statistics class. Construct the associated cumulative frequency distribution for this data set, using the same class width and limits. 7. For the distribution of this data set, qualitatively describe the skewness and modality
Step by Step Solution
There are 3 Steps involved in it
1 Expert Approved Answer
Step: 1 Unlock

Question Has Been Solved by an Expert!
Get step-by-step solutions from verified subject matter experts
Step: 2 Unlock
Step: 3 Unlock