

Question: . 6. The accompanying data table shows the value, in dollars, of a certain stock index as an annual time series. Use the data to

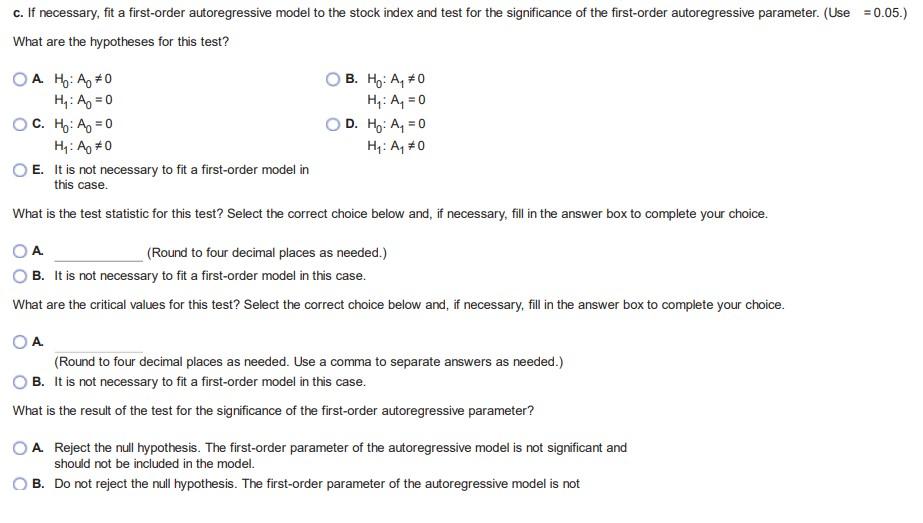
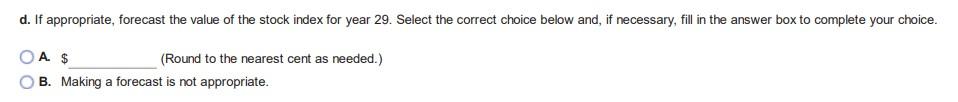
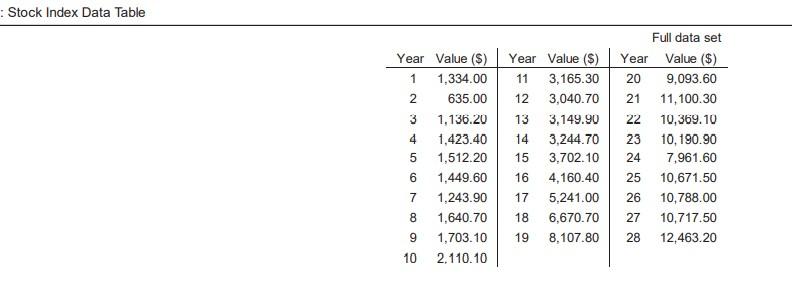
. 6. The accompanying data table shows the value, in dollars, of a certain stock index as an annual time series. Use the data to complete parts (a) through (d). c. If necessary, fit a first-order autoregressive model to the stock index and test for the significance of the first-order autoregressive parameter. (Use = 0.05.) What are the hypotheses for this test? O A. Ho: A #0 H: A = 0 OC. Ho: A = 0 H: Ap *0 E. It is not necessary to fit a first-order model in this case. B. Hy: A*0 H: A, = 0 D. Ho: A = 0 Hy: A, 70 What is the test statistic for this test? Select the correct choice below and, if necessary, fill in the answer box to complete your choice. A (Round to four decimal places as needed.) B. It is not necessary to fit a first-order model in this case. What are the critical values for this test? Select the correct choice below and, if necessary, fill in the answer box to complete your choice. (Round to four decimal places as needed. Use a comma to separate answers as needed.) B. It is not necessary to fit a first-order model in this case. What is the result of the test for the significance of the first-order autoregressive parameter? A Reject the null hypothesis. The first-order parameter of the autoregressive model is not significant and should not be included in the model. B. Do not reject the null hypothesis. The first-order parameter of the autoregressive model is not d. If appropriate, forecast the value of the stock index for year 29. Select the correct choice below and, if necessary, fill in the answer box to complete your choice. OA $ (Round to the nearest cent as needed.) B. Making a forecast is not appropriate. Stock Index Data Table Year Value ($) 1 1,334.00 2 635.00 3 1,136.20 4 1,423.40 5 1,512.20 6 1,449.60 7 1,243.90 8 1,640.70 9 1,703.10 10 2.110.10 Year Value (S) 11 3,165.30 12 3,040.70 13 3,149.90 14 3,244.70 15 3,702.10 16 4,160.40 17 5.241.00 18 6,670.70 19 8.107.80 Full data set Year Value ($) 20 9,093.60 21 11, 100.30 22 10,369.10 23 10,190.90 24 7,961.60 25 10,671.50 26 10,788.00 27 10,717.50 28 12,463.20 . 6. The accompanying data table shows the value, in dollars, of a certain stock index as an annual time series. Use the data to complete parts (a) through (d). c. If necessary, fit a first-order autoregressive model to the stock index and test for the significance of the first-order autoregressive parameter. (Use = 0.05.) What are the hypotheses for this test? O A. Ho: A #0 H: A = 0 OC. Ho: A = 0 H: Ap *0 E. It is not necessary to fit a first-order model in this case. B. Hy: A*0 H: A, = 0 D. Ho: A = 0 Hy: A, 70 What is the test statistic for this test? Select the correct choice below and, if necessary, fill in the answer box to complete your choice. A (Round to four decimal places as needed.) B. It is not necessary to fit a first-order model in this case. What are the critical values for this test? Select the correct choice below and, if necessary, fill in the answer box to complete your choice. (Round to four decimal places as needed. Use a comma to separate answers as needed.) B. It is not necessary to fit a first-order model in this case. What is the result of the test for the significance of the first-order autoregressive parameter? A Reject the null hypothesis. The first-order parameter of the autoregressive model is not significant and should not be included in the model. B. Do not reject the null hypothesis. The first-order parameter of the autoregressive model is not d. If appropriate, forecast the value of the stock index for year 29. Select the correct choice below and, if necessary, fill in the answer box to complete your choice. OA $ (Round to the nearest cent as needed.) B. Making a forecast is not appropriate. Stock Index Data Table Year Value ($) 1 1,334.00 2 635.00 3 1,136.20 4 1,423.40 5 1,512.20 6 1,449.60 7 1,243.90 8 1,640.70 9 1,703.10 10 2.110.10 Year Value (S) 11 3,165.30 12 3,040.70 13 3,149.90 14 3,244.70 15 3,702.10 16 4,160.40 17 5.241.00 18 6,670.70 19 8.107.80 Full data set Year Value ($) 20 9,093.60 21 11, 100.30 22 10,369.10 23 10,190.90 24 7,961.60 25 10,671.50 26 10,788.00 27 10,717.50 28 12,463.20
Step by Step Solution
There are 3 Steps involved in it

Get step-by-step solutions from verified subject matter experts