

Question: 6. Use the hypothetical data shown in the table below to answer the following questions. Year Number Killed in Number Injured in Number of Vehicle
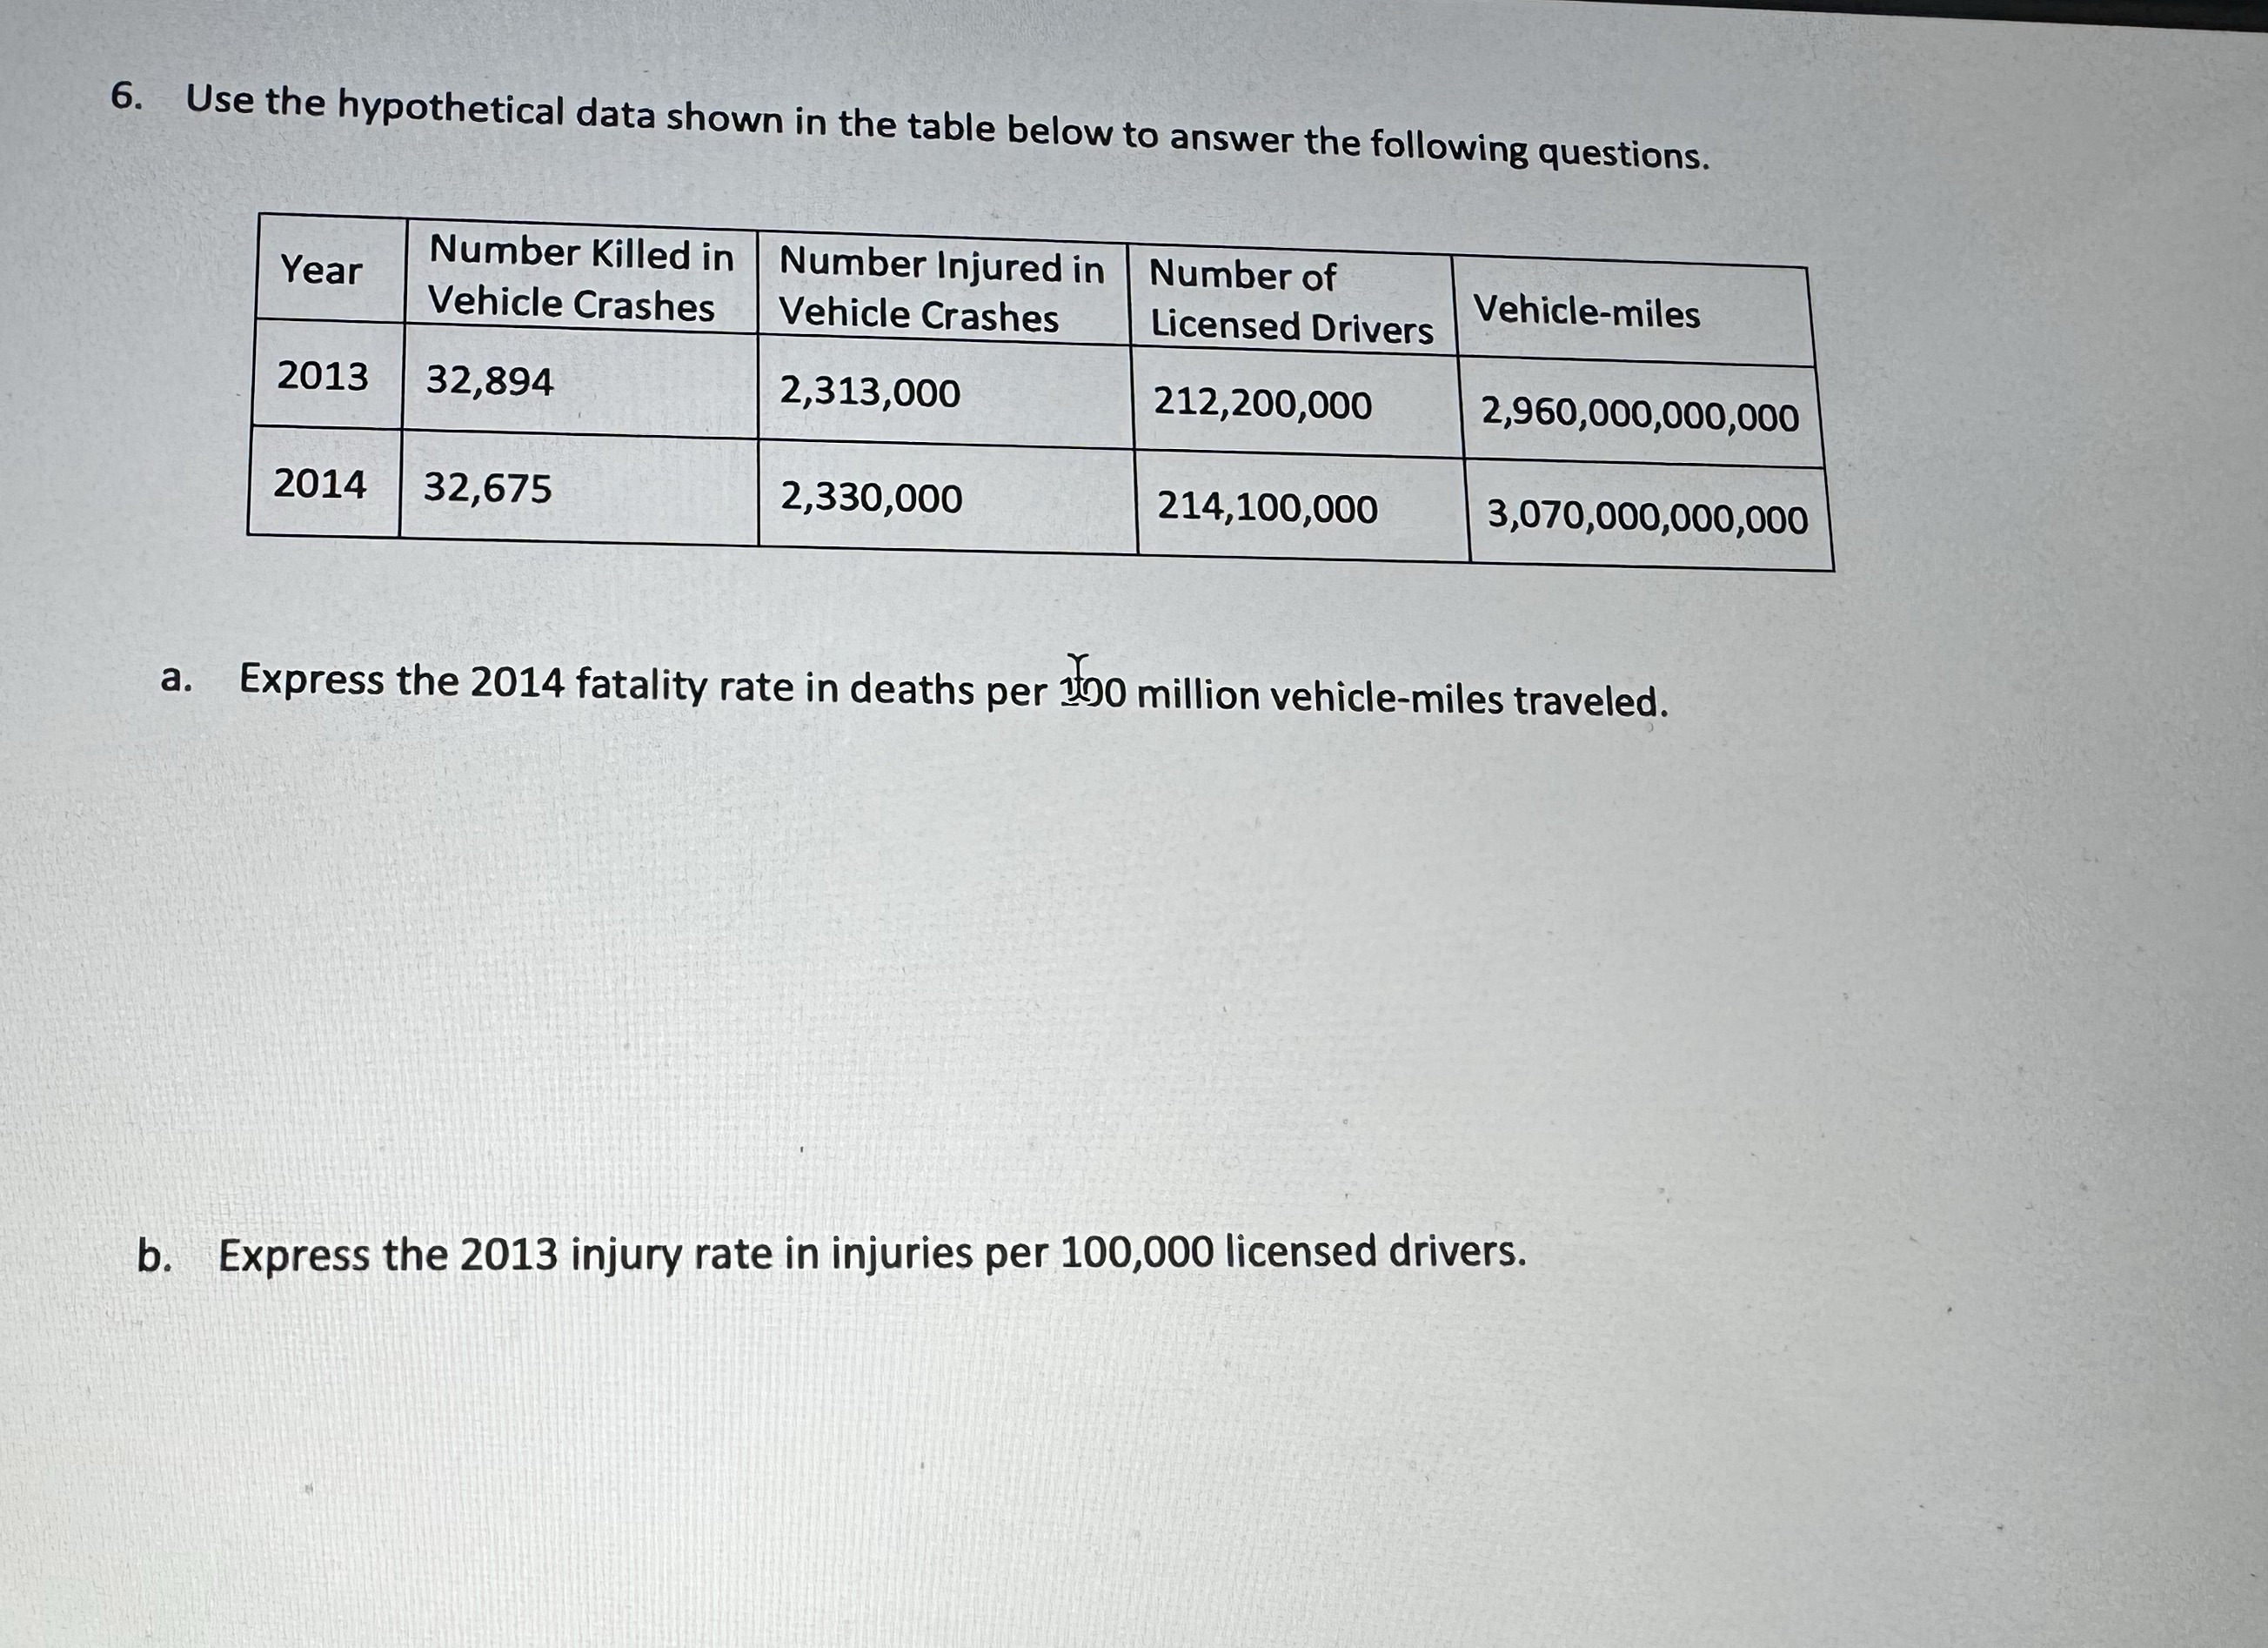
6. Use the hypothetical data shown in the table below to answer the following questions. Year Number Killed in Number Injured in Number of Vehicle Crashes Vehicle Crashes Licensed Drivers Vehicle-miles 2013 32,894 2,313,000 212,200,000 2,960,000,000,000 2014 32,675 2,330,000 214,100,000 3,070,000,000,000 a. Express the 2014 fatality rate in deaths per 190 million vehicle-miles traveled. b. Express the 2013 injury rate in injuries per 100,000 licensed drivers
Step by Step Solution
There are 3 Steps involved in it
1 Expert Approved Answer
Step: 1 Unlock

Question Has Been Solved by an Expert!
Get step-by-step solutions from verified subject matter experts
Step: 2 Unlock
Step: 3 Unlock