

Question: 6. Use the table below, based on data from students enrolled in BMGT 230 this semester, to answer/complete parts a. through e. (the cell
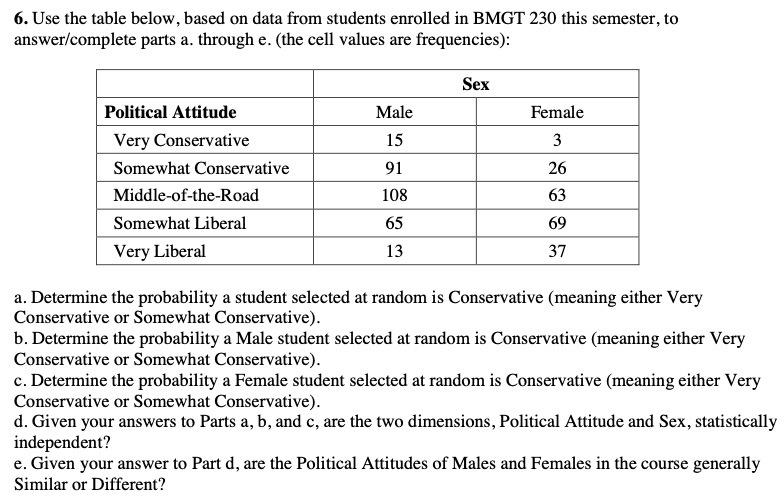
6. Use the table below, based on data from students enrolled in BMGT 230 this semester, to answer/complete parts a. through e. (the cell values are frequencies): Sex Political Attitude Male Female Very Conservative 15 3 Somewhat Conservative 91 26 Middle-of-the-Road 108 63 Somewhat Liberal 65 69 Very Liberal 13 37 a. Determine the probability a student selected at random is Conservative (meaning either Very Conservative or Somewhat Conservative). b. Determine the probability a Male student selected at random is Conservative (meaning either Very Conservative or Somewhat Conservative). c. Determine the probability a Female student selected at random is Conservative (meaning either Very Conservative or Somewhat Conservative). d. Given your answers to Parts a, b, and c, are the two dimensions, Political Attitude and Sex, statistically independent? e. Given your answer to Part d, are the Political Attitudes of Males and Females in the course generally Similar or Different?
Step by Step Solution
There are 3 Steps involved in it
To answer the questions lets calculate the probabilities based on the given table Sex Political Attitude Frequency Male Very Conservative 15 Male Some... View full answer

Get step-by-step solutions from verified subject matter experts