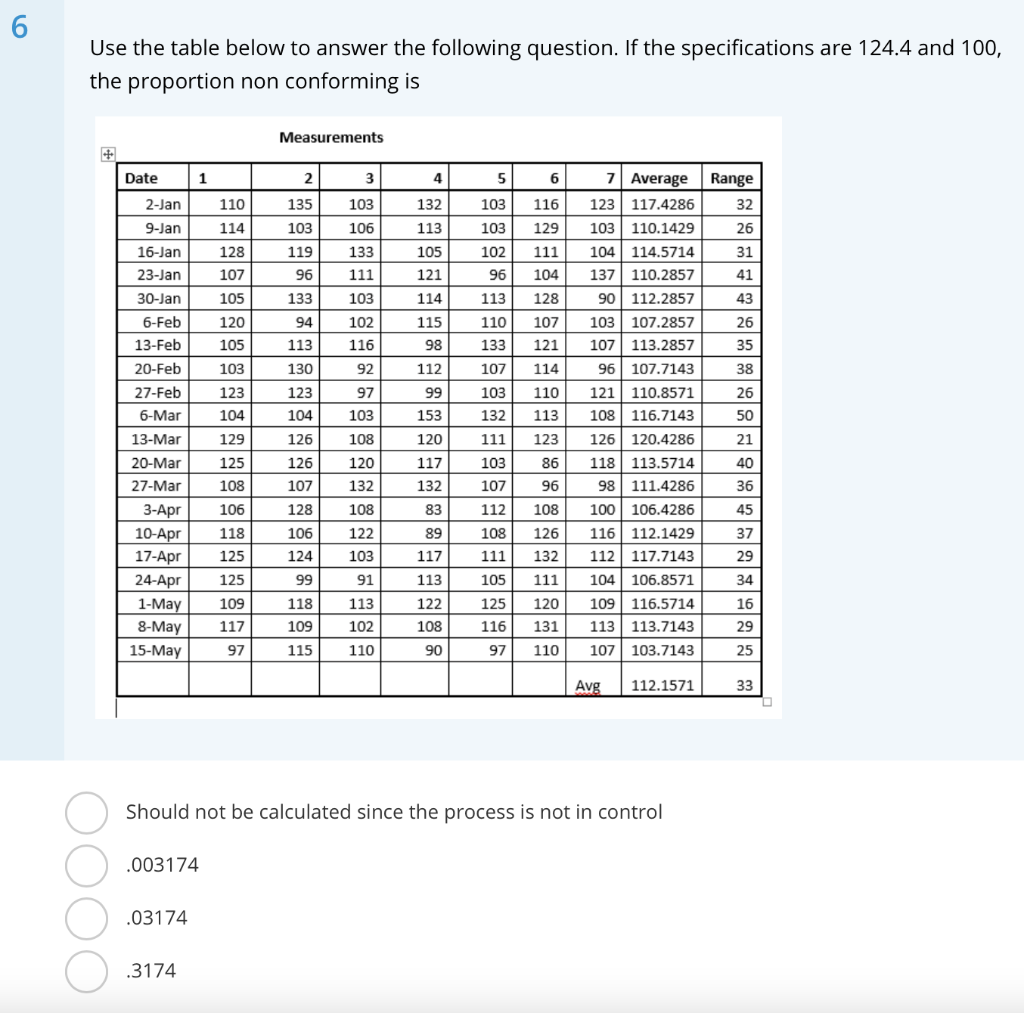
Question: 6 Use the table below to answer the following question. If the specifications are 124.4 and 100, the proportion non conforming is Measurements Date 1

6 Use the table below to answer the following

6 Use the table below to answer the following question. If the specifications are 124.4 and 100, the proportion non conforming is Measurements Date 1 2 3 4 5 6 2-Jan 110 135 103 132 103 103 9-Jan 16-Jan 114 128 106 133 111 113 105 121 103 102 119 96 116 129 111 107 104 TTT 96 113 133 103 114 94 102 110 133 113 115 98 112 116 92 107 130 123 104 97 103 99 153 103 132 23-Jan 30-Jan 6-Feb 13-Feb 20-Feb 27-Feb 6-Mar 13-Mar 20-Mar 27-Mar 3-Apr 10-Apr 17-Apr 24-Apr 126 7 Average Range 123 | 117.4286 32 103 110.1429 26 104 114.5714 31 137 110.2857 41 90 | 112.2857 43 103 107.2857 26 107 113.2857 35 96 | 107.7143 38 121110.8571 26 108 116.7143 50 126 120.4286 21 118 113.5714 40 98 | 111.4286 36 100 106.4286 45 116 112.1429 37 112 | 117.7143 29 104 106.8571 34 109 116.5714 16 113 113.7143 29 108 105 120 105 103 123 104 129 125 108 106 118 125 125 109 120 12 107 117 132 111 103 107 112 128 107 121 114 110 113 123 86 96 108 126 132 111 120 131 110 120 132 108 122 103 91 128 106 124 108 111 83 89 117 113 122 108 99 1-May 8-May 15-May 118 109 113 102 105 125 116 117 97 115 110 90 97 107 103.7143 25 Avg 112.1571 33 Should not be calculated since the process is not in control .003174 .03174 .3174

Step by Step Solution

There are 3 Steps involved in it

1 Expert Approved Answer
Step: 1 Unlock blur-text-image
Question Has Been Solved by an Expert!

Get step-by-step solutions from verified subject matter experts

Step: 2 Unlock
Step: 3 Unlock

Students Have Also Explored These Related General Management Questions!