

Question: 1) In the graphs consider the market info and then draw the curves beginning at equilibrium show what happens when the event(s) take place.
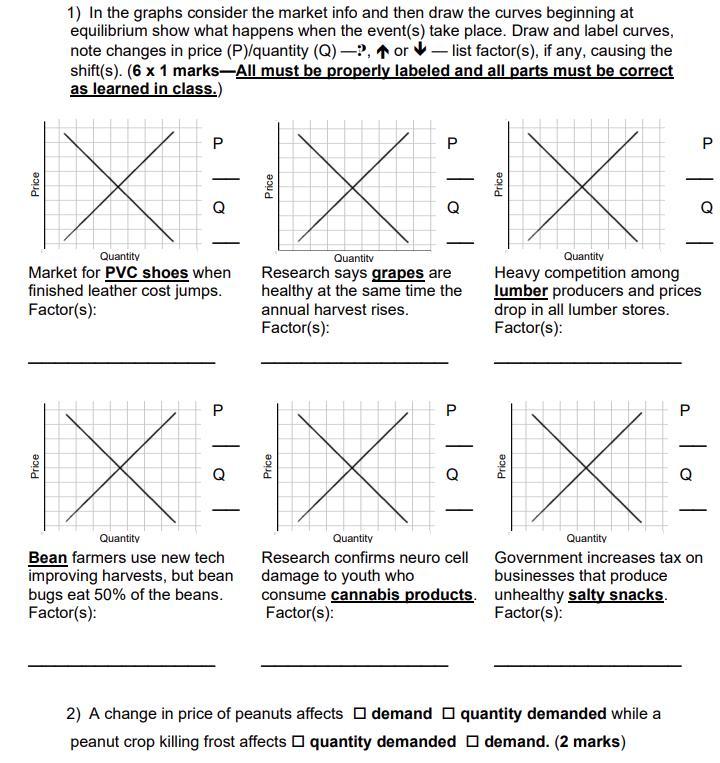
1) In the graphs consider the market info and then draw the curves beginning at equilibrium show what happens when the event(s) take place. Draw and label curves, note changes in price (P)/quantity (Q)-?, or list factor(s), if any, causing the shift(s). (6 x 1 marks-All must be properly labeled and all parts must be correct as learned in class.) Price P P XXX Quantity Q Market for PVC shoes when finished leather cost jumps. Factor(s): Quantity Q Research says grapes are healthy at the same time the annual harvest rises. Factor(s): Quantity Heavy competition among lumber producers and prices drop in all lumber stores. Factor(s): P P XXX Quantity Q - Bean farmers use new tech improving harvests, but bean bugs eat 50% of the beans. Factor(s): Quantity Q Research confirms neuro cell damage to youth who consume cannabis products. Factor(s): Quantity P - Q Government increases tax on businesses that produce unhealthy salty snacks. Factor(s): 2) A change in price of peanuts affects demand quantity demanded while a peanut crop killing frost affects quantity demanded demand. (2 marks) P
Step by Step Solution
3.51 Rating (154 Votes )
There are 3 Steps involved in it
1 In the market for PVC shoes when the cost of finished leather jumps it would lead to a decrease in the supply of PVC shoes This can be represented b... View full answer

Get step-by-step solutions from verified subject matter experts