

Question: 6) Using the graph in Figurel show how node H computes its new routing table (assume it uses the DVR protocol) using the costs associated
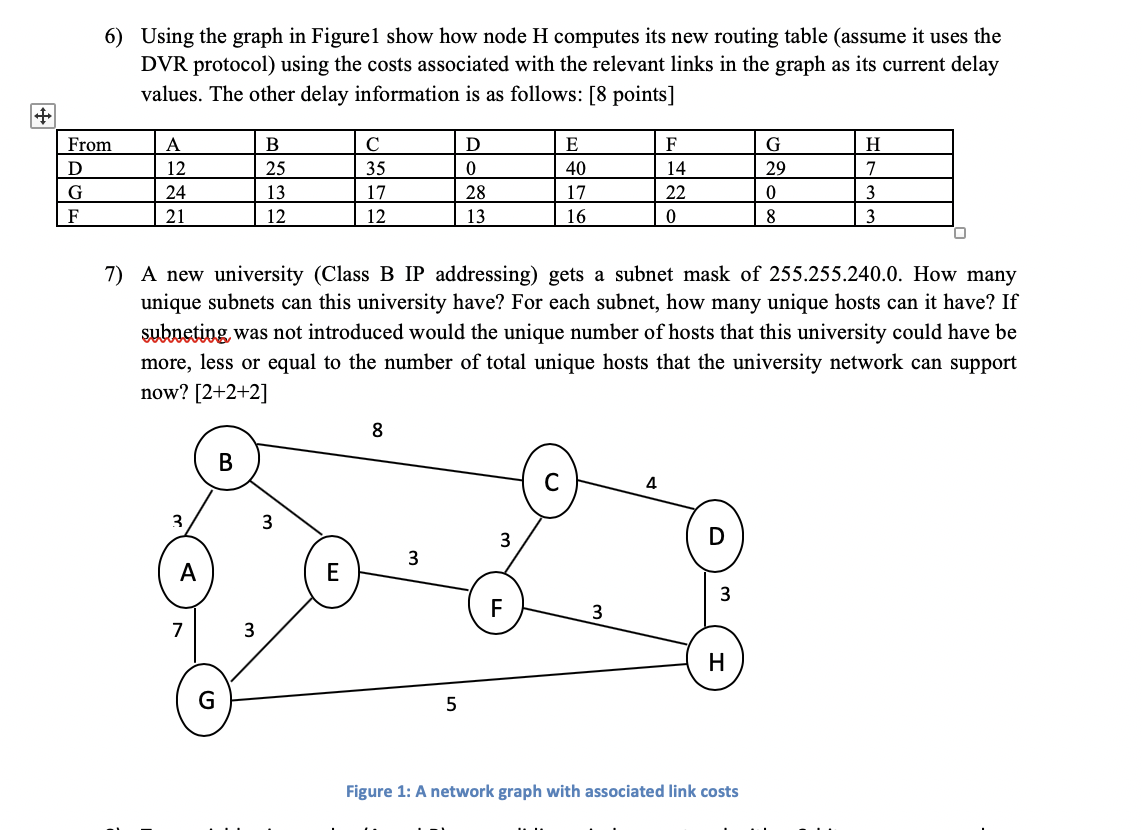
6) Using the graph in Figurel show how node H computes its new routing table (assume it uses the DVR protocol) using the costs associated with the relevant links in the graph as its current delay values. The other delay information is as follows: [8 points] From A F G A | 12 D 29 B 25 | 13 12 DE 0 40 28 | 17 13 16 35 17 12 24 14 22 0 21 8 7) A new university (Class B IP addressing) gets a subnet mask of 255.255.240.0. How many unique subnets can this university have? For each subnet, how many unique hosts can it have? If subpeting was not introduced would the unique number of hosts that this university could have be more, less or equal to the number of total unique hosts that the university network can support now? [2+2+2] 3 Figure 1: A network graph with associated link costs
Step by Step Solution
There are 3 Steps involved in it

Get step-by-step solutions from verified subject matter experts