

Question: 6) We used A to connect preferences with observable demand and then made an assumption that preferences are B to deduce that the area under
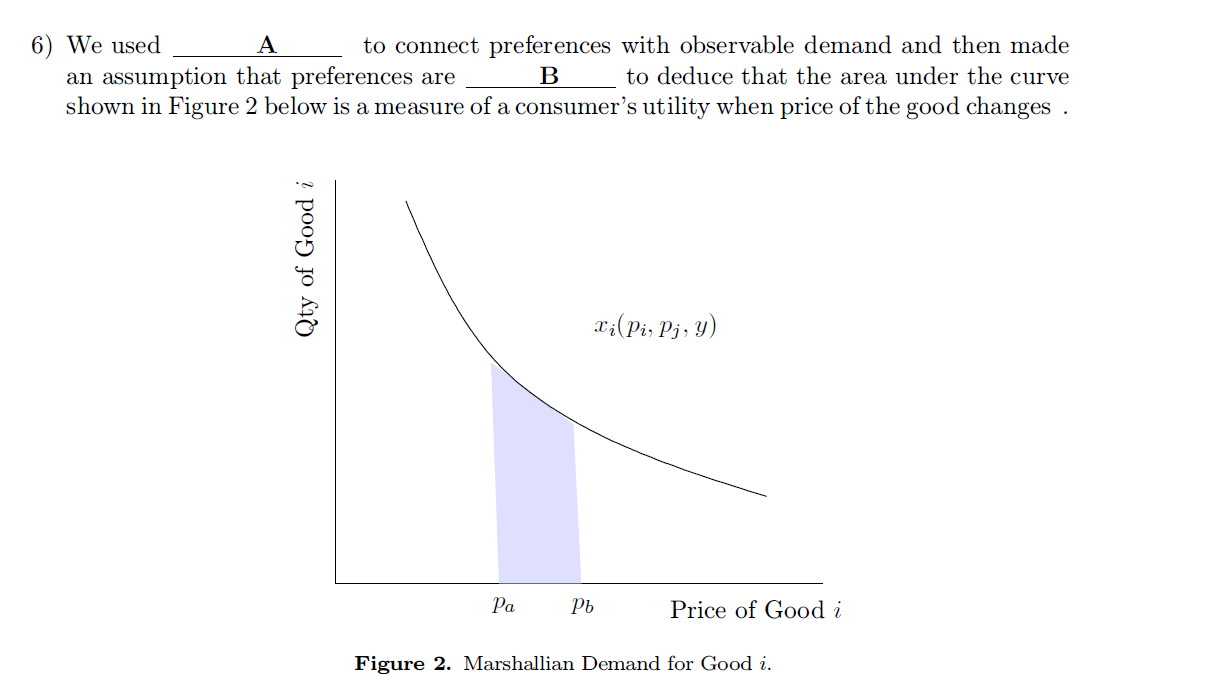
6) We used A to connect preferences with observable demand and then made an assumption that preferences are B to deduce that the area under the curve shown in Figure 2 below is a measure of a consumer's utility when price of the good changes . Qty of Good v2 Pa Pb Price of Good 2' Figure 2. Marshallian Demand for Good 2
Step by Step Solution
There are 3 Steps involved in it
1 Expert Approved Answer
Step: 1 Unlock

Question Has Been Solved by an Expert!
Get step-by-step solutions from verified subject matter experts
Step: 2 Unlock
Step: 3 Unlock