

Question: 6. which graph illustrates the change in the soft drinks market? Explain. 7. The behavior of the supply curve for soft drinks? Explain. 8. The
6. which graph illustrates the change in the soft drinks market? Explain.
7. The behavior of the supply curve for soft drinks? Explain.
8. The behavior of the demand curve for soft drinks? Explain.
9. The behavior of the equilibrium price of soft drinks? Explain.
10. The behavior of the equilibrium quantity of soft drinks? Explain.
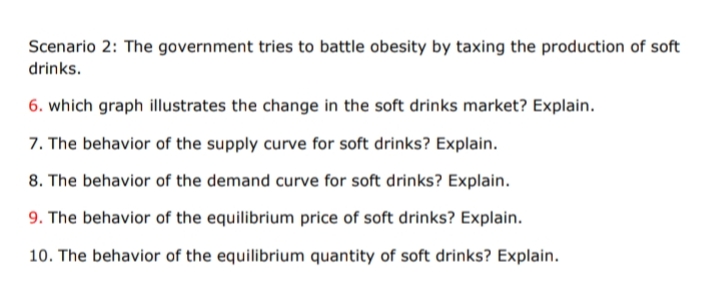
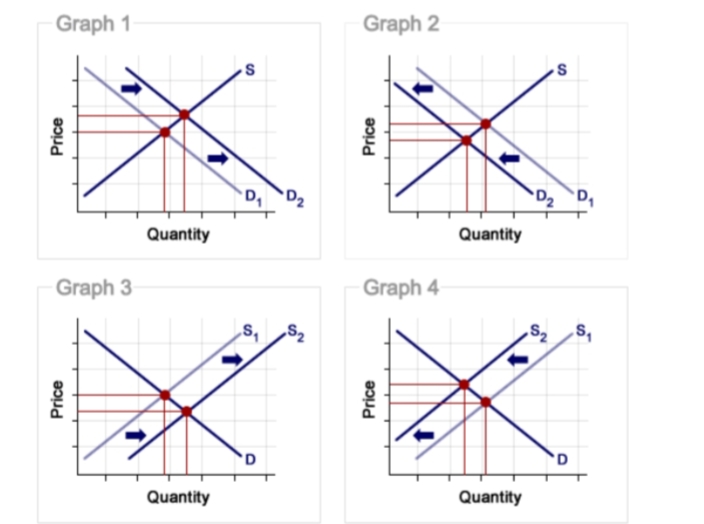
Scenario 2: The government tries to battle obesity by taxing the production of soft drinks. 6. which graph illustrates the change in the soft drinks market? Explain. 7. The behavior of the supply curve for soft drinks? Explain. 8. The behavior of the demand curve for soft drinks? Explain. 9. The behavior of the equilibrium price of soft drinks? Explain. 10. The behavior of the equilibrium quantity of soft drinks? Explain.Graph 1 Graph 2 S S Price Price D1 D2 D2 D1 Quantity Quantity Graph 3 Graph 4 S. S. 52 Price Price D D Quantity Quantity
Step by Step Solution
There are 3 Steps involved in it

Get step-by-step solutions from verified subject matter experts