

Question: 6. Your non-destructive evaluation team has collected data on solid-state, imaging detectors which produce electronic/digital images of the components under test. The effectiveness of this

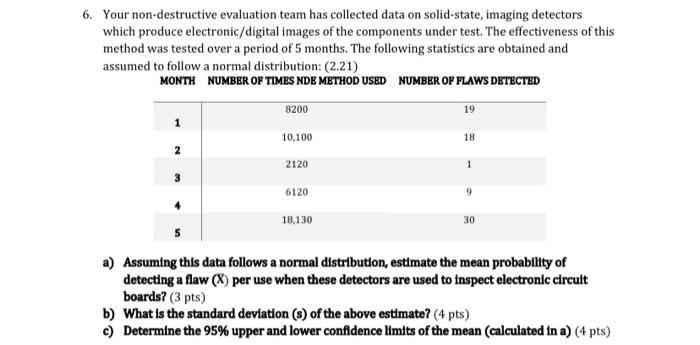
6. Your non-destructive evaluation team has collected data on solid-state, imaging detectors which produce electronic/digital images of the components under test. The effectiveness of this method was tested over a period of 5 months. The following statistics are obtained and assumed to follow a normal distribution: (2.21) MONTH NUMBER OF TIMES NDE METHOD USED NUMBER OF FLAWS DETECTED 8200 19 10.100 18 2 2120 6120 18.130 30 a) Assuming this data follows a normal distribution, estimate the mean probability of detecting a flaw (X) per use when these detectors are used to inspect electronic circuit boards? (3 pts) b) What is the standard deviation (s) of the above estimate? (4 pts) c) Determine the 95% upper and lower confidence limits of the mean (calculated in a) (4 pts)
Step by Step Solution
There are 3 Steps involved in it

Get step-by-step solutions from verified subject matter experts