

Question: 60 50 40 30 20 10 The graph below represents the budget constraint and three possible indifference curves for a student. Assume that py=4.
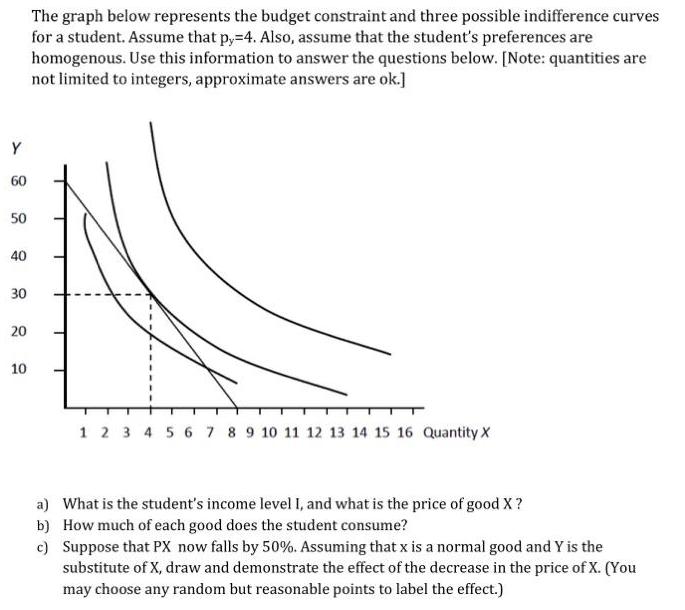
60 50 40 30 20 10 The graph below represents the budget constraint and three possible indifference curves for a student. Assume that py=4. Also, assume that the student's preferences are homogenous. Use this information to answer the questions below. [Note: quantities are not limited to integers, approximate answers are ok.] 1 2 3 4 5 6 7 8 9 10 11 12 13 14 15 16 Quantity X a) What is the student's income level I, and what is the price of good X? b) How much of each good does the student consume? c) Suppose that PX now falls by 50%. Assuming that x is a normal good and Y is the substitute of X, draw and demonstrate the effect of the decrease in the price of X. (You may choose any random but reasonable points to label the effect.)
Step by Step Solution
There are 3 Steps involved in it
From the given graph depicting the budget constraint and indifference curves we can infer the following information to answer the questions a To find ... View full answer

Get step-by-step solutions from verified subject matter experts