

Question: 60 63 66 69 72 75 Figure 2.25 Dotplot with n = 100 for Exercises 2.91 to 2.93 2.88 Estimate the mean and the standard
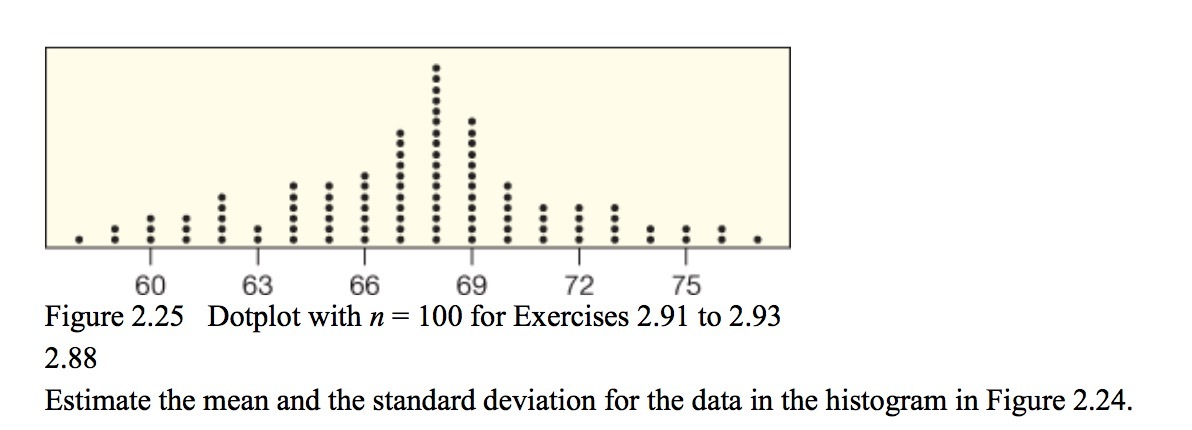
60 63 66 69 72 75 Figure 2.25 Dotplot with n = 100 for Exercises 2.91 to 2.93 2.88 Estimate the mean and the standard deviation for the data in the histogram in Figure 2.24
Step by Step Solution
There are 3 Steps involved in it
1 Expert Approved Answer
Step: 1 Unlock

Question Has Been Solved by an Expert!
Get step-by-step solutions from verified subject matter experts
Step: 2 Unlock
Step: 3 Unlock