

Question: (60 pts) R 14-3 An Excel worksheet, titled Midterm Data, is available online. Our team is charged to analyze the actual impact of using a
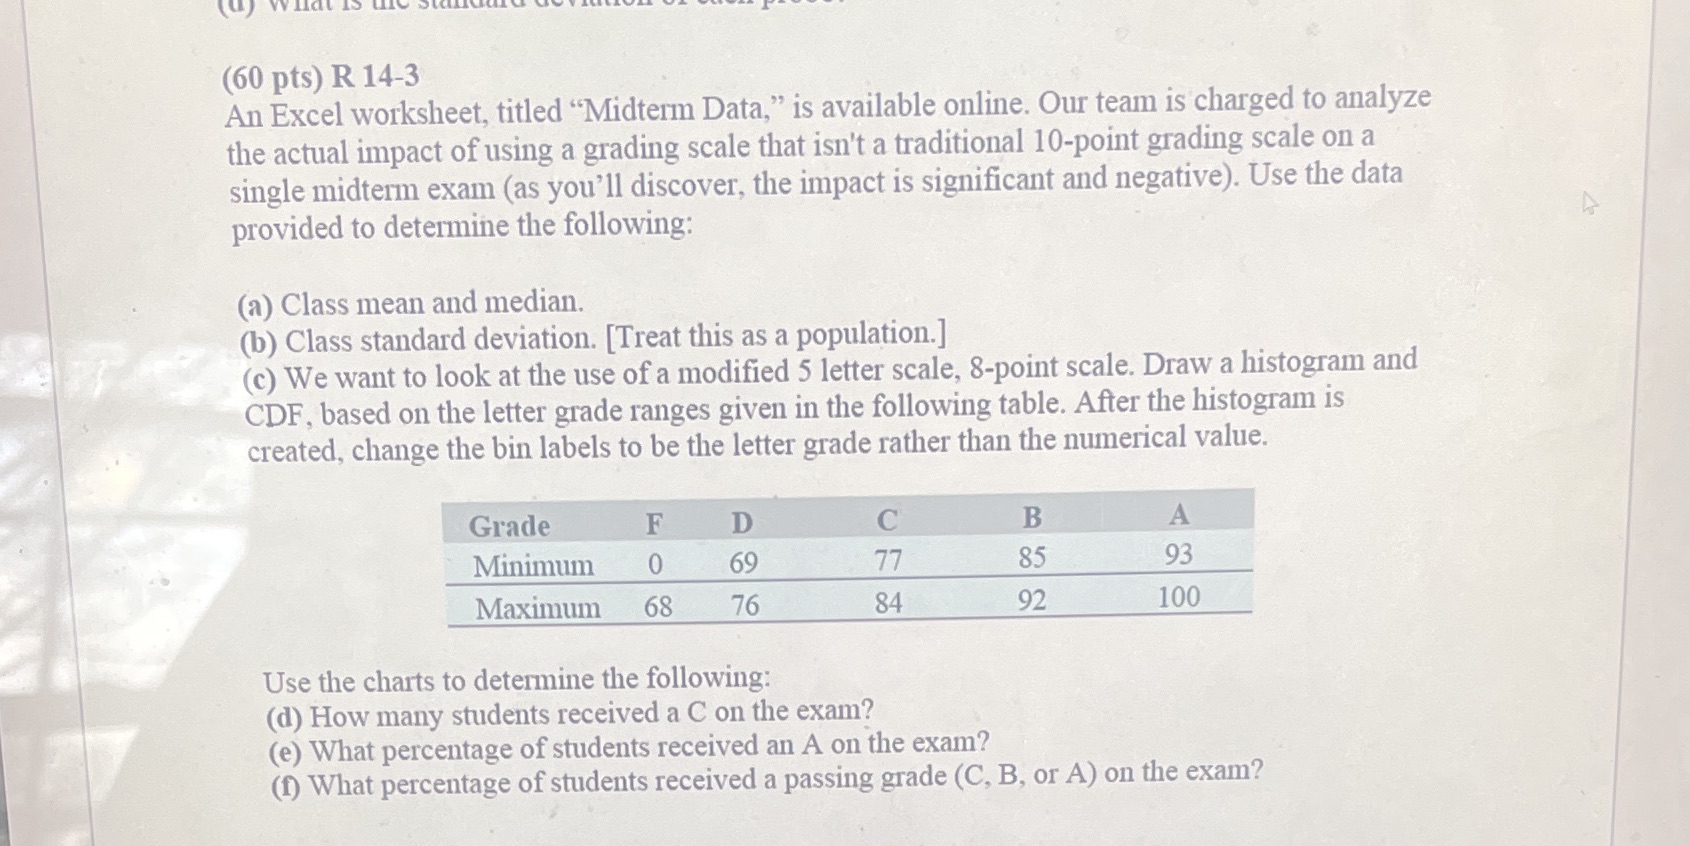
(60 pts) R 14-3 An Excel worksheet, titled "Midterm Data," is available online. Our team is charged to analyze the actual impact of using a grading scale that isn't a traditional 10-point grading scale on a single midterm exam (as you'll discover, the impact is significant and negative). Use the data provided to determine the following: (a) Class mean and median. (b) Class standard deviation. [Treat this as a population.] (c) We want to look at the use of a modified 5 letter scale, 8-point scale. Draw a histogram and CDF, based on the letter grade ranges given in the following table. After the histogram is created, change the bin labels to be the letter grade rather than the numerical value. Grade F D C B A Minimum 0 69 77 85 93 Maximum 68 76 84 92 100 Use the charts to determine the following: (d) How many students received a C on the exam? (e) What percentage of students received an A on the exam? (f) What percentage of students received a passing grade (C, B, or A) on the exam
Step by Step Solution
There are 3 Steps involved in it

Get step-by-step solutions from verified subject matter experts