Question: 6:00 AM VO cal 25.2 VO 25.3 000 25.25 24.9 25.1 25.1 25.2 247 25.4 26.1 26 10 25.45 25.15 as 25.15 COM 12 Noor
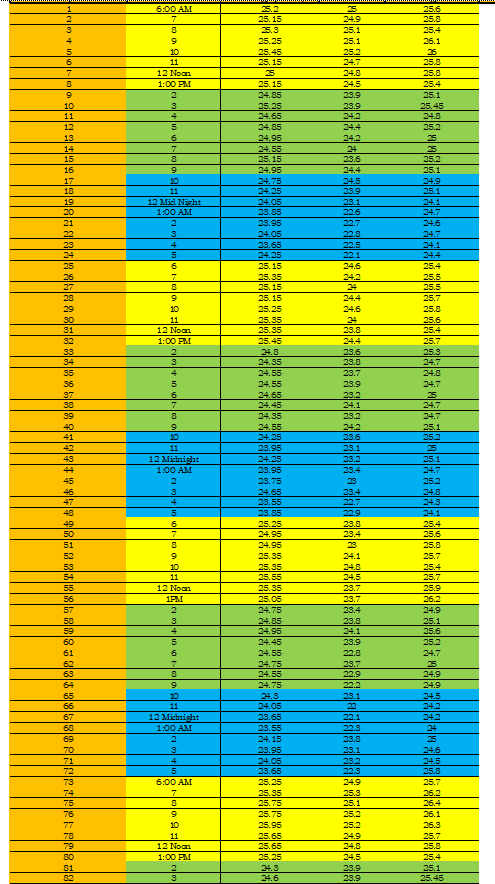
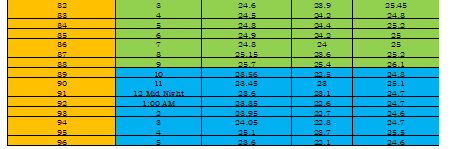
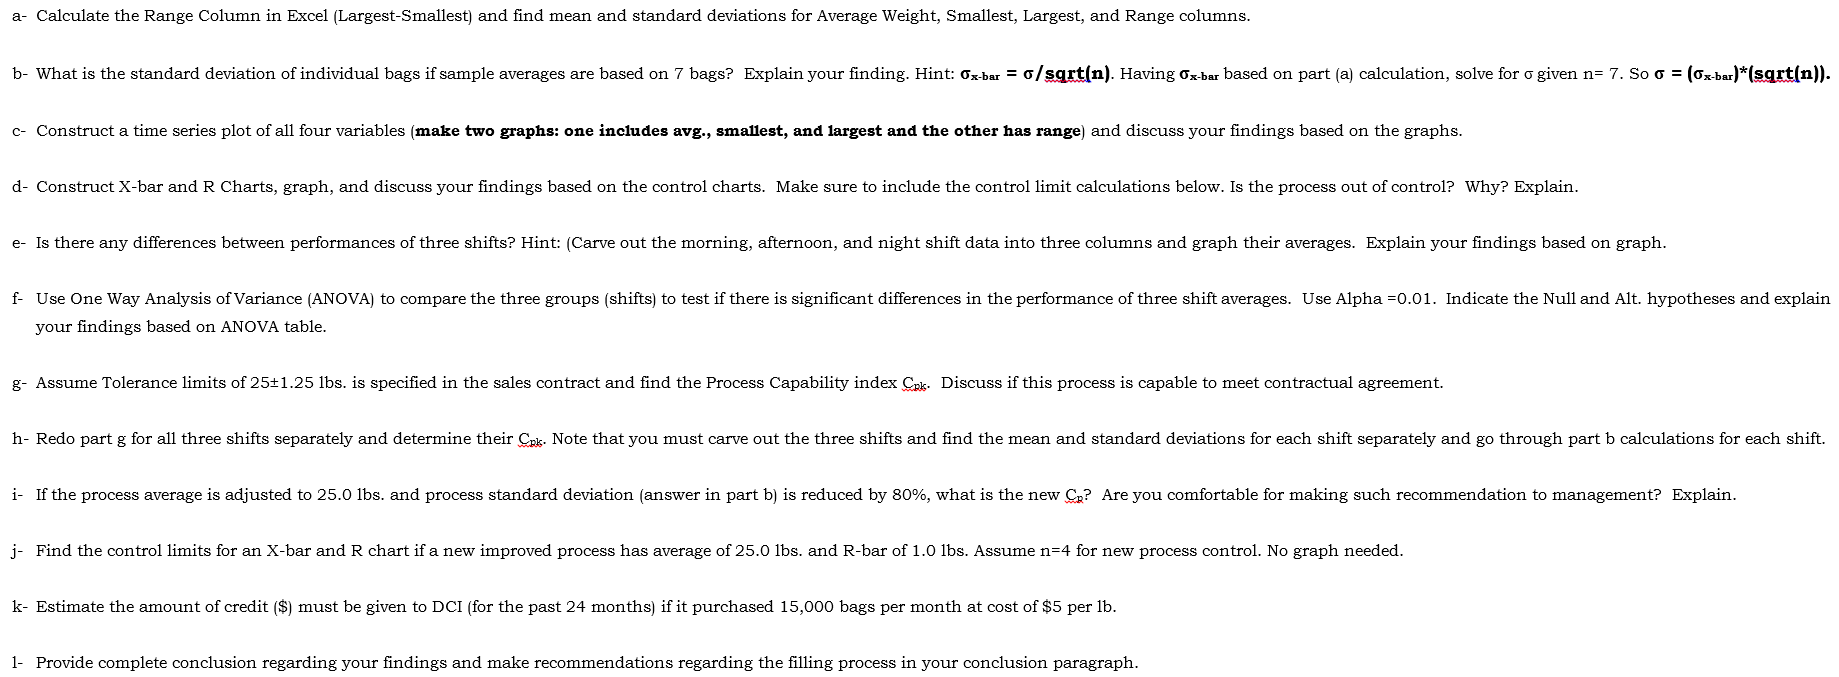
6:00 AM VO cal 25.2 VO 25.3 000 25.25 24.9 25.1 25.1 25.2 247 25.4 26.1 26 10 25.45 25.15 as 25.15 COM 12 Noor 1:00 PM CINCO 24.5 23.9 23.9 24.2 24.4 242 24 23.6 24.4 24,5 29.9 23.1 22.6 22.7 23.8 + Ra|88|8a|aa| || 12 Mid Night 1:00 AM 24.9 25.1 w 24.1 24.7 24.6 -O 5 BS CINCO 24.6 25.5 25.5 25.7 25.8 NW++ UN 244 24.6 12 Noon 1:00 PM 25.4 25.7 CU O BUVO 063 34.7 24.8 24.7 |88|8 | la la 23.8 244 23.6 29.8 23.7 23.9 23.2 24.1 23.2 242 23.6 23.1 23.2 23.4 12 Michieda 1:00 AM 25.2 Be Ba|888988a8 9 888 98 x 8 988 & 9988888888888888885 G16 24.3 24.1 25.6 25.8 25.7 25.4 25.7 lala lalalalaalalaala onco 12 Noor CINO ACICIO 24.9 25.1 25.6 25.2 O NO 24.75 24.3 24.05 24.1 24.8 24.5 23.7 14 23.7 23.4 23.8 24.1 23.9 22.8 23.7 22.9 22.2 23.1 ze 22.1 22.3 23.8 23.1 23.2 22.3 24.9 25.3 25.1 25.2 25.2 24.9 24.8 25 24.9 24.9 24.5 242 24.2 245 24 25 12 Michnis: 1:00 AM Con 8 i ono 6:00 AM ECO 25.73 DE 25.95 26.4 . 26.1 26.3 25.7 25.8 12 Noon 1:00 PM 68 69 1888 acolo 13 CO3 25.1 25.45 82 09 34.6 38.9 25.45 3 4 5 9.4 24.4 2 6 34 86 97 35 29.2 9 24.3 2 26.7 28.56 23.45 25. 90 23 11 12 Mint 1:00 AM 25.1 247 9 29.95 94 95 95 115 24.05 23.1 29.6 24.7 3. 4 a- Calculate the Range Column in Excel (Largest-Smallest) and find mean and standard deviations for Average Weight, Smallest, Largest, and Range columns. b- What is the standard deviation of individual bags if sample averages are based on 7 bags? Explain your finding. Hint: Ox-bar = g/sqrt(n). Having Ox-bar based on part (a) calculation, solve for a given n= 7. So o = (5x-bar)*(sqrt(n)). C- Construct a time series plot of all four variables (make two graphs: one includes avg., smallest, and largest and the other has range) and discuss your findings based on the graphs. d- Construct X-bar and R Charts, graph, and discuss your findings based on the control charts. Make sure to include the control limit calculations below. Is the process out of control? Why? Explain. e- Is there any differences between performances of three shifts? Hint: (Carve out the morning, afternoon, and night shift data into three columns and graph their averages. Explain your findings based on graph. f- Use One Way Analysis of Variance (ANOVA) to compare the three groups (shifts) to test if there is significant differences in the performance of three shift averages. Use Alpha =0.01. Indicate the Null and Alt. hypotheses and explain your findings based on ANOVA table. g- Assume Tolerance limits of 25+1.25 lbs. is specified in the sales contract and find the Process Capability index Cols Discuss if this process is capable to meet contractual agreement. h- Redo part g for all three shifts separately and determine their ok. Note that you must carve out the three shifts and find the mean and standard deviations for each shift separately and go through part b calculations for each shift. i- If the process average is adjusted to 25.0 lbs. and process standard deviation (answer in part b) is reduced by 80%, what is the new Ce? Are you comfortable for making such recommendation to management? Explain. j- Find the control limits for an X-bar and R chart if a new improved process has average of 25.0 lbs. and R-bar of 1.0 lbs. Assume n=4 for new process control. No graph needed. k- Estimate the amount of credit ($) must be given to DCI (for the past 24 months) if it purchased 15,000 bags per month at cost of $5 per lb. 1- Provide complete conclusion regarding your findings and make recommendations regarding the filling process in your conclusion paragraph. 6:00 AM VO cal 25.2 VO 25.3 000 25.25 24.9 25.1 25.1 25.2 247 25.4 26.1 26 10 25.45 25.15 as 25.15 COM 12 Noor 1:00 PM CINCO 24.5 23.9 23.9 24.2 24.4 242 24 23.6 24.4 24,5 29.9 23.1 22.6 22.7 23.8 + Ra|88|8a|aa| || 12 Mid Night 1:00 AM 24.9 25.1 w 24.1 24.7 24.6 -O 5 BS CINCO 24.6 25.5 25.5 25.7 25.8 NW++ UN 244 24.6 12 Noon 1:00 PM 25.4 25.7 CU O BUVO 063 34.7 24.8 24.7 |88|8 | la la 23.8 244 23.6 29.8 23.7 23.9 23.2 24.1 23.2 242 23.6 23.1 23.2 23.4 12 Michieda 1:00 AM 25.2 Be Ba|888988a8 9 888 98 x 8 988 & 9988888888888888885 G16 24.3 24.1 25.6 25.8 25.7 25.4 25.7 lala lalalalaalalaala onco 12 Noor CINO ACICIO 24.9 25.1 25.6 25.2 O NO 24.75 24.3 24.05 24.1 24.8 24.5 23.7 14 23.7 23.4 23.8 24.1 23.9 22.8 23.7 22.9 22.2 23.1 ze 22.1 22.3 23.8 23.1 23.2 22.3 24.9 25.3 25.1 25.2 25.2 24.9 24.8 25 24.9 24.9 24.5 242 24.2 245 24 25 12 Michnis: 1:00 AM Con 8 i ono 6:00 AM ECO 25.73 DE 25.95 26.4 . 26.1 26.3 25.7 25.8 12 Noon 1:00 PM 68 69 1888 acolo 13 CO3 25.1 25.45 82 09 34.6 38.9 25.45 3 4 5 9.4 24.4 2 6 34 86 97 35 29.2 9 24.3 2 26.7 28.56 23.45 25. 90 23 11 12 Mint 1:00 AM 25.1 247 9 29.95 94 95 95 115 24.05 23.1 29.6 24.7 3. 4 a- Calculate the Range Column in Excel (Largest-Smallest) and find mean and standard deviations for Average Weight, Smallest, Largest, and Range columns. b- What is the standard deviation of individual bags if sample averages are based on 7 bags? Explain your finding. Hint: Ox-bar = g/sqrt(n). Having Ox-bar based on part (a) calculation, solve for a given n= 7. So o = (5x-bar)*(sqrt(n)). C- Construct a time series plot of all four variables (make two graphs: one includes avg., smallest, and largest and the other has range) and discuss your findings based on the graphs. d- Construct X-bar and R Charts, graph, and discuss your findings based on the control charts. Make sure to include the control limit calculations below. Is the process out of control? Why? Explain. e- Is there any differences between performances of three shifts? Hint: (Carve out the morning, afternoon, and night shift data into three columns and graph their averages. Explain your findings based on graph. f- Use One Way Analysis of Variance (ANOVA) to compare the three groups (shifts) to test if there is significant differences in the performance of three shift averages. Use Alpha =0.01. Indicate the Null and Alt. hypotheses and explain your findings based on ANOVA table. g- Assume Tolerance limits of 25+1.25 lbs. is specified in the sales contract and find the Process Capability index Cols Discuss if this process is capable to meet contractual agreement. h- Redo part g for all three shifts separately and determine their ok. Note that you must carve out the three shifts and find the mean and standard deviations for each shift separately and go through part b calculations for each shift. i- If the process average is adjusted to 25.0 lbs. and process standard deviation (answer in part b) is reduced by 80%, what is the new Ce? Are you comfortable for making such recommendation to management? Explain. j- Find the control limits for an X-bar and R chart if a new improved process has average of 25.0 lbs. and R-bar of 1.0 lbs. Assume n=4 for new process control. No graph needed. k- Estimate the amount of credit ($) must be given to DCI (for the past 24 months) if it purchased 15,000 bags per month at cost of $5 per lb. 1- Provide complete conclusion regarding your findings and make recommendations regarding the filling process in your conclusion paragraph


