

Question: 6.2. Data has been collected from a chemical reactor. The inlet concentration was the only input variable that changed when the data was collected.
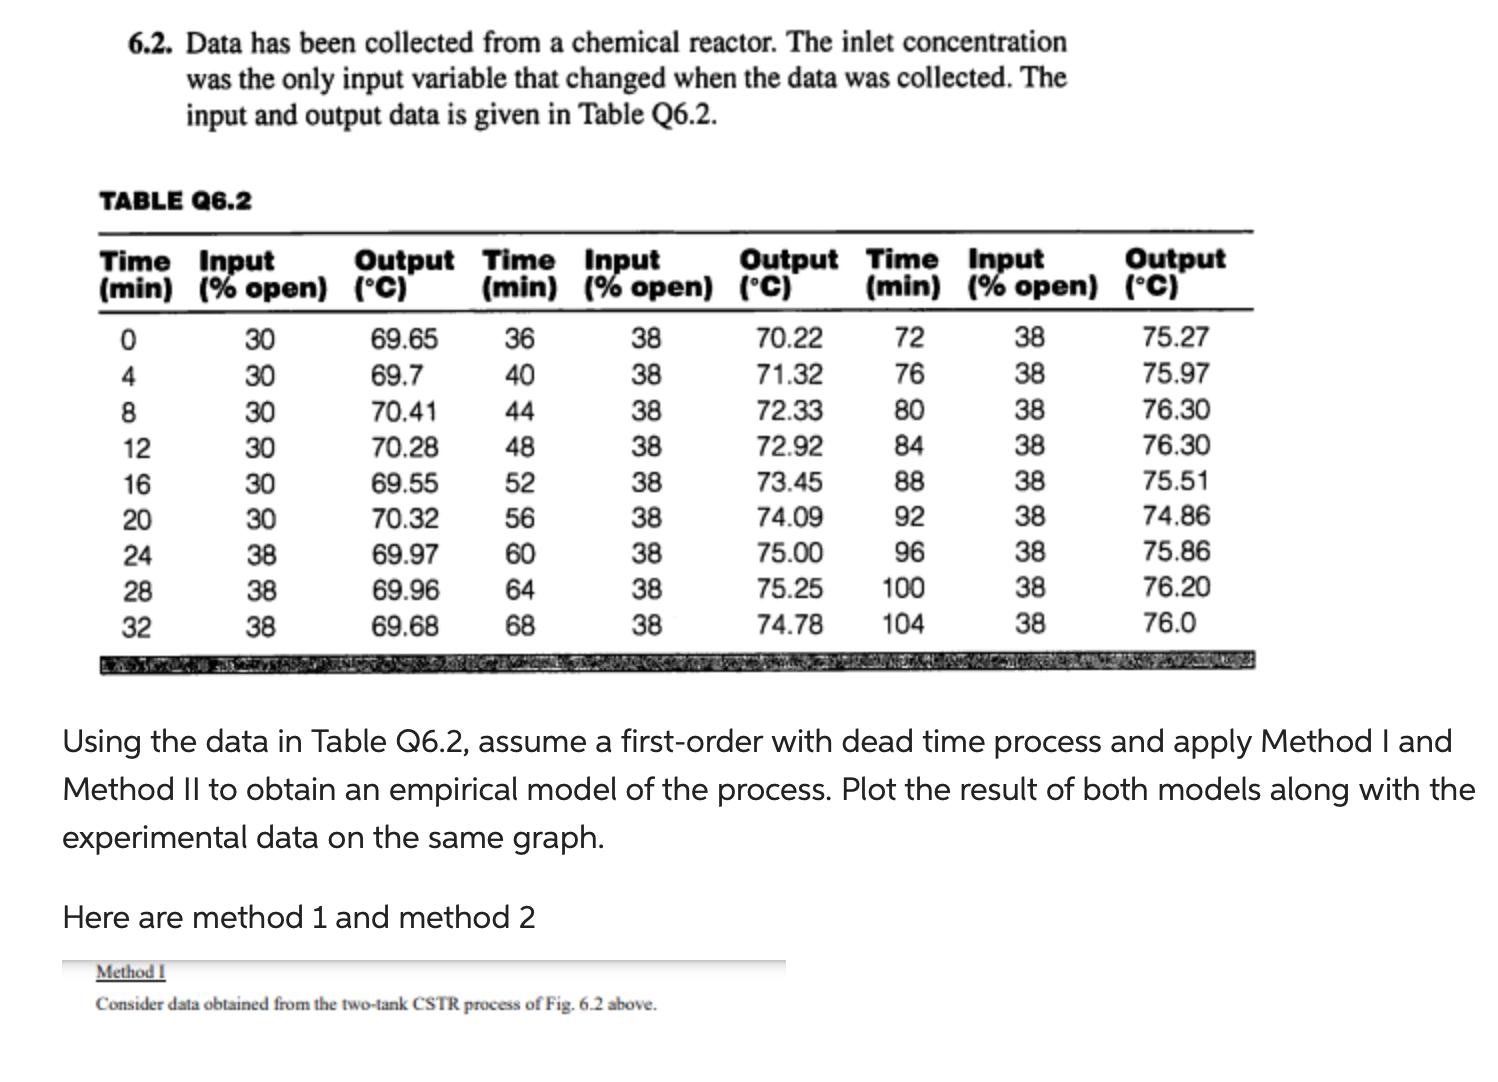
6.2. Data has been collected from a chemical reactor. The inlet concentration was the only input variable that changed when the data was collected. The input and output data is given in Table Q6.2. TABLE Q6.2 Time Input (min) (% open) 0 4 8 12 16 20 24 28 32 30 30 30 30 30 30 38 38 38 Output Time Input (C) 69.65 69.7 70.41 70.28 69.55 70.32 69.97 69.96 69.68 (min) (% open) 36 40 44 48 52 56 60 64 68 38 38 38 38 38 38 Here are method 1 and method 2 38 38 38 Output Time Input (C) (min) (% open) Method I Consider data obtained from the two-tank CSTR process of Fig. 6.2 above. 70.22 71.32 72.33 72.92 73.45 74.09 75.00 75.25 100 74.78 104 72 76 80 84 88 92 96 38 38 38 38 38 38 38 38 38 Output (C) Using the data in Table Q6.2, assume a first-order with dead time process and apply Method I and Method II to obtain an empirical model of the process. Plot the result of both models along with the experimental data on the same graph. 75.27 75.97 76.30 76.30 75.51 74.86 75.86 76.20 76.0
Step by Step Solution
There are 3 Steps involved in it
To obtain an empirical model of the process using a firstorder with dead time model we will apply Me... View full answer

Get step-by-step solutions from verified subject matter experts