

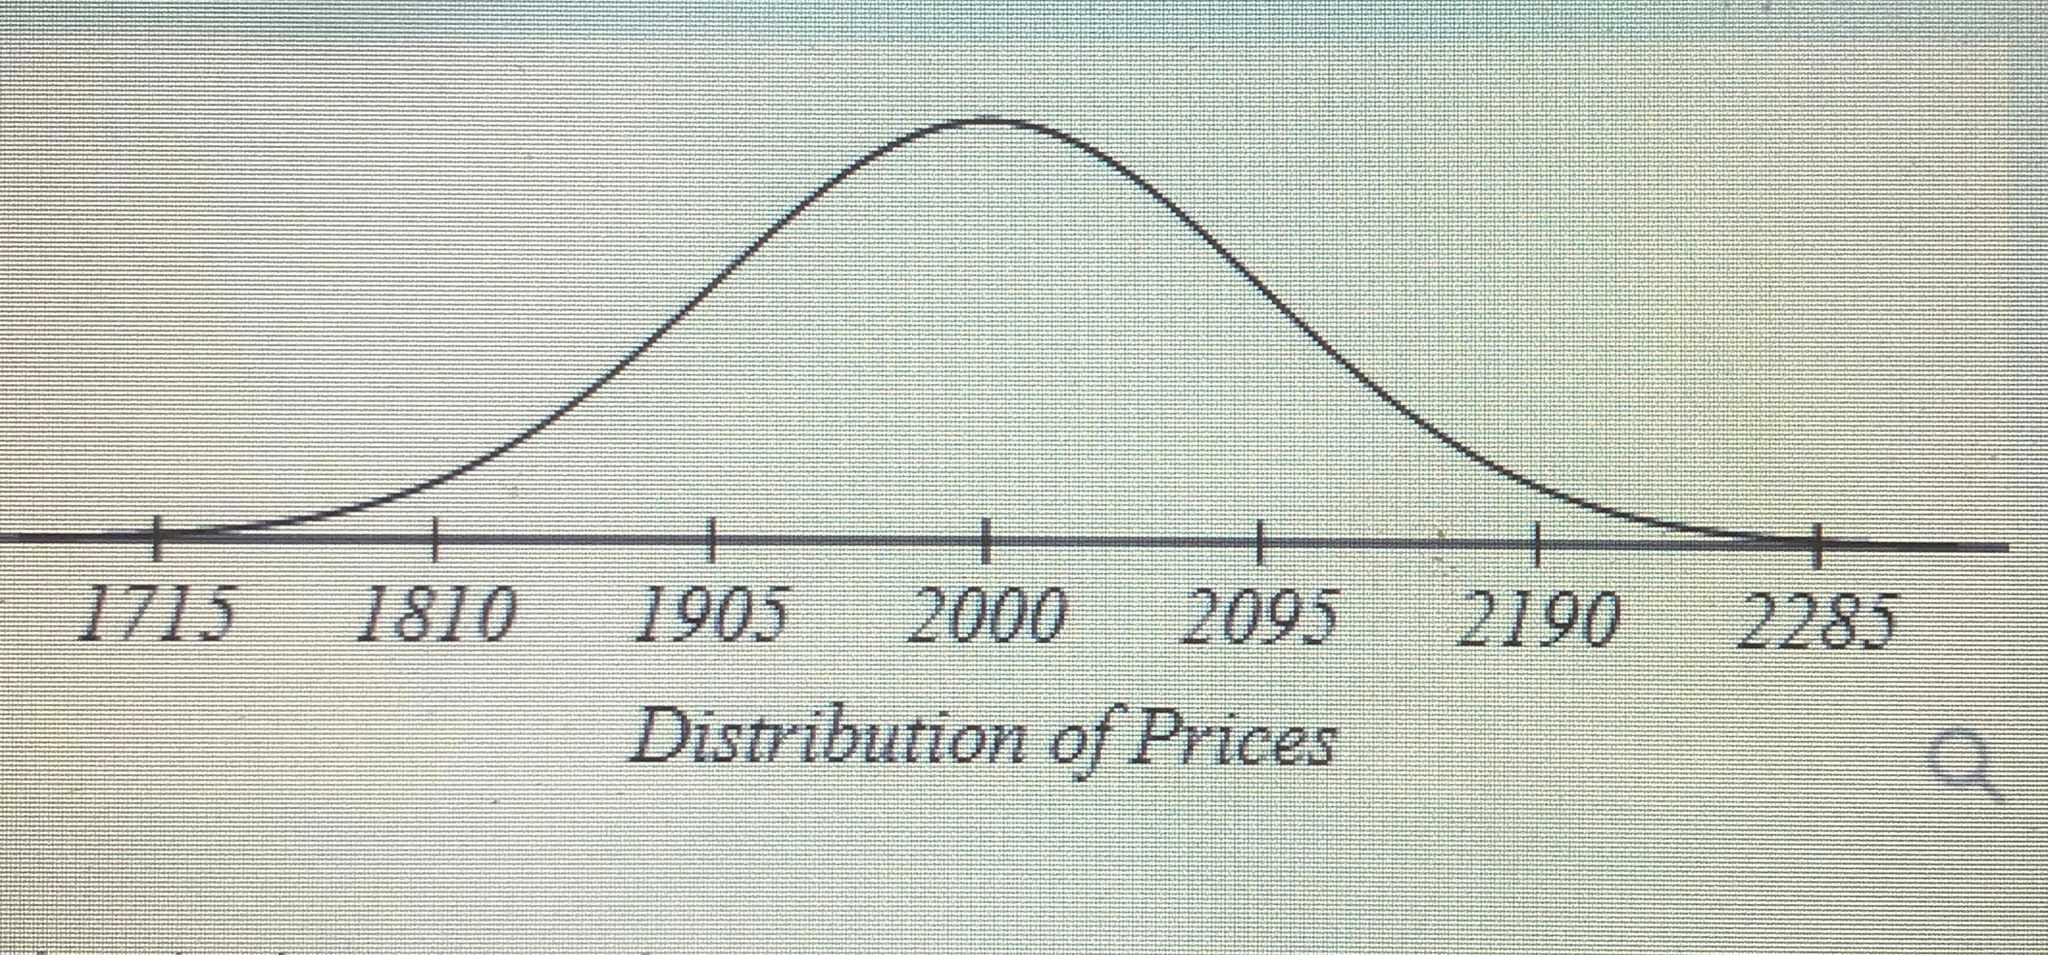
Question: #62 The graph illustrates a normal distribution for the prices paid for a particular model of HD television. The mean price paid is $2000 and
#62
The graph illustrates a normal distribution for the prices paid for a particular model of HD television. The mean price paid is $2000 and the standard deviation is $95.
\f
Step by Step Solution
There are 3 Steps involved in it
1 Expert Approved Answer
Step: 1 Unlock

Question Has Been Solved by an Expert!
Get step-by-step solutions from verified subject matter experts
Step: 2 Unlock
Step: 3 Unlock