

Question: 63. Refer to the Baseball 2016 data, which reports information on the 2016 Major League Baseball season. Let attendance be the dependent variable and total
63. Refer to the Baseball 2016 data, which reports information on the 2016 Major League Baseball season. Let attendance be the dependent variable and total team sal-ary be the independent variable. Determine the regression equation and answer the following questions.a. Draw a scatter diagram. From the diagram, does there seem to be a direct relation-ship between the two variables? b. What is the expected attendance for a team with a salary of $100.0 million? c. If the owners pay an additional $30 million, how many more people could they ex-pect to attend? d. At the .05 significance level, can we conclude that the slope of the regression line is positive? Conduct the appropriate test of hypothesis. e. What percentage of the variation in attendance is accounted for by salary? f. Determine the correlation between attendance and team batting average and be-tween attendance and team ERA. Which is stronger? Conduct an appropriate test of hypothesis for each set of variables.
64. Refer to the Lincolnville School bus data. Develop a regression equation that ex-presses the relationship between age of the bus and maintenance cost. The age of the bus is the independent variable.a. Draw a scatter diagram. What does this diagram suggest as to the relationship be-tween the two variables? Is it direct or indirect? Does it appear to be strong or weak?b. Develop a regression equation. How much does an additional year add to the main-tenance cost. What is the estimated maintenance cost for a 10-year-old bus?c. Conduct a test of hypothesis to determine whether the slope of the regression line is greater than zero. Use the .05 significance level. Interpret your findings from parts (a), (b), and (c) in a brief report.

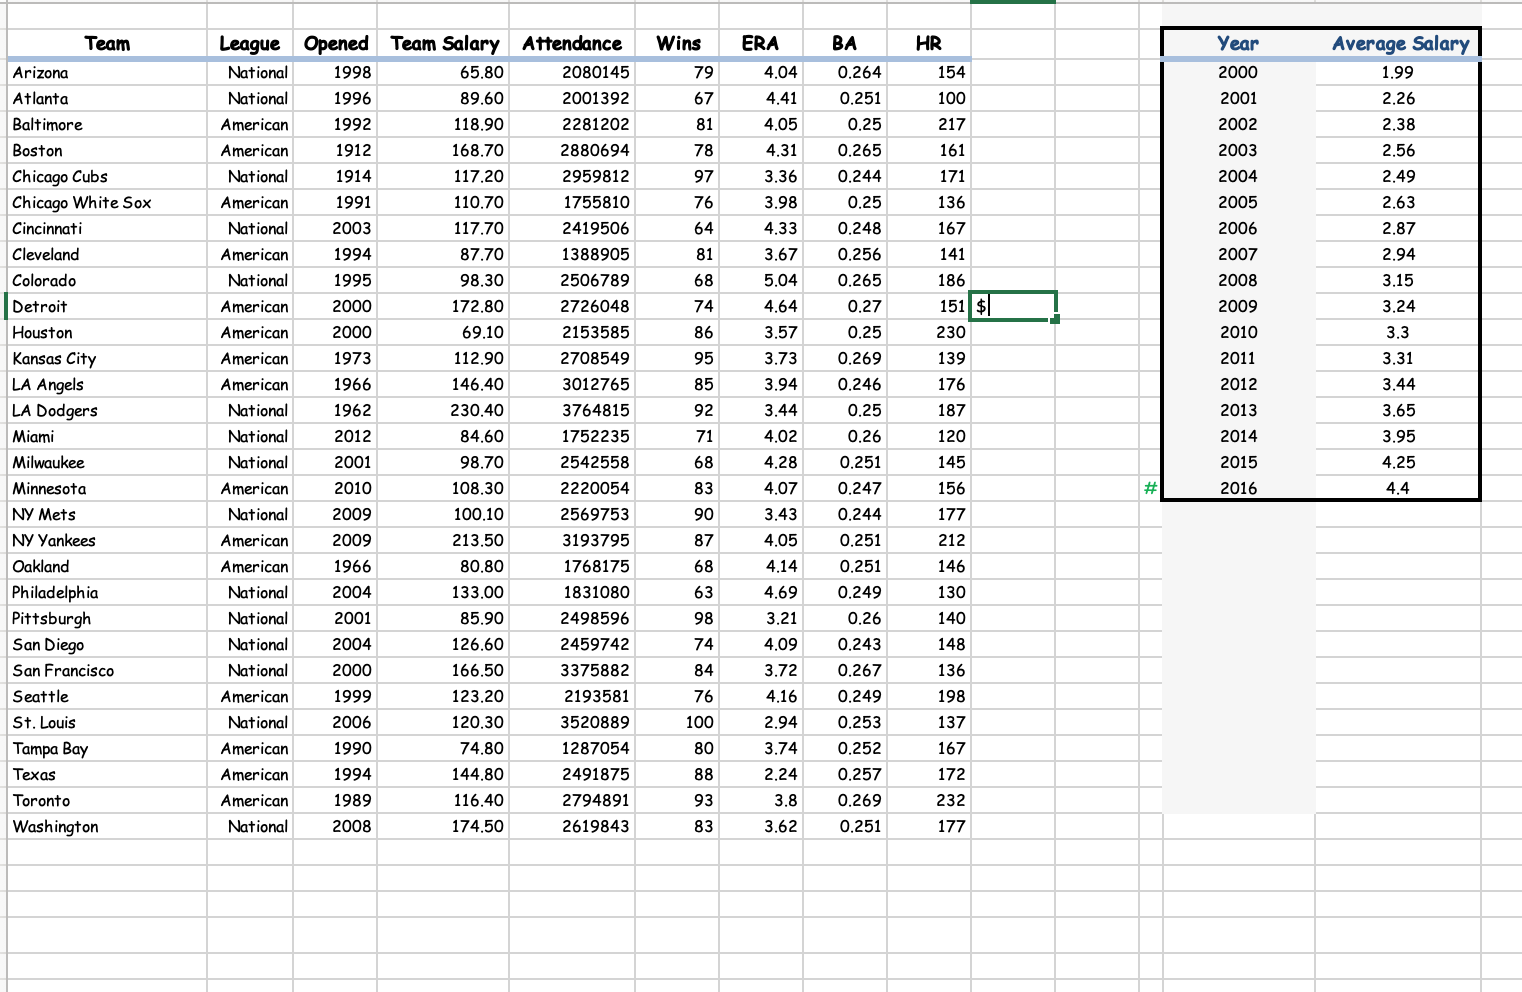
Data Set 3 --Lincolnville School District Bus Data Engine Type Maintenance Odometer ID Manufacturer (0=diesel) Capacity Cost Age Miles 4646 54375 Thompson 1072 21858 122 Bluebird 9394 1.16580 751 1078 22444 279 Bluebird 1008 22672 Bluebird 5329 50765 520 Bluebird 4794 1 19130 37872 714 Bluebird 3742 73703 875 Bluebird 4376 97947 500 Bluebird 4832 119860 Bluebird 5160 1.17760 Bluebird 195 Bluebird 2775 Bluebird 69438 365 Keiser 3065 63384 162 keiser 8143 31266 586 Bluebird 1569 34674 370 7766 36528 887 Bluebird 3743 93672 164 Bluebird 2540 34530 948 Keiser 1342 97956 678 keiser 3361 75229 181 3097 34362 Bluebird 8263 102969 Bluebird 1218 83424 Bluebird 2028 40824 Bluebird Bluebird 9069 98307 Bluebird 71970 Keiser 9193 101889 4795 106605 Bluebird 505 10276 Bluebird 2732 70122 724 3754 32 keiser 4640 196 880 ser 8410 65Team League Opened Team Salary Attendance Wins ERA BA HR year Average Salary Arizona 1998 65.80 2080145 79 4.04 0.264 154 2000 National 0.251 100 2001 2.26 Atlanta National 1996 89.60 2001392 67 4.41 118.90 2281202 81 4.05 217 2002 2.38 Baltimore American 1992 Boston American 1912 168.70 2880694 78 4.31 0.265 161 2003 2004 2.49 Chicago Cubs National 1914 117.20 2959812 97 3.36 0.244 171 2005 2.63 Chicago White Sox American 1991 110.70 1755810 76 3.98 0.25 136 2006 Cincinnati National 2003 117.70 2419506 64 4.33 0.248 167 Cleveland American 1994 87.70 1388905 81 3.67 0.256 141 2007 2008 3.15 Colorado National 1995 98.30 2506789 68 5.04 0.265 186 Detroit American 2000 172.80 2726048 74 4.64 0.27 151 $ 2009 3.24 Houston American 2000 69.10 2153585 86 3.57 0.25 230 2010 3.3 112.90 2708549 0.269 2011 Kansas City American 1973 95 3.73 139 3.31 LA Angels American 1966 146.40 3012765 85 3.94 0.246 176 2012 3.44 3.65 LA Dodgers National 1962 230.40 3764815 92 0.25 187 2013 Miami National 2012 84.60 1752235 71 0.26 120 National 2001 98.70 2542558 68 4.28 0.251 145 2015 Milwaukee 4.4 Minnesota American 2010 108.30 2220054 83 4.07 0.247 156 2016 Ny Mets National 2009 100.10 2569753 90 3.43 0.244 177 NY yankees American 2009 213.50 3193795 87 4.05 0.251 212 Oakland American 1966 80.80 1768175 68 4.14 0.251 146 Philadelphia National 2004 133.00 1831080 63 4.69 0.249 130 Pittsburgh National 2001 85.90 2498596 98 0.26 San Diego National 2004 126.60 2459742 74 4.09 0.243 148 San Francisco National 2000 166.50 3375882 84 3.72 0.267 136 Seattle American 1999 123.20 2193581 76 4.16 0.249 198 St. Louis National 2006 120.30 3520889 100 2.94 0.253 137 Tampa Bay American 1990 74.80 1287054 80 3.74 0.252 167 Texas American 144.80 2491875 88 2.24 0.257 172 Toronto American 1989 116.40 2794891 93 3.8 0.269 232 Washington National 2008 174.50 2619843 83 3.62 0.251 177
Step by Step Solution
There are 3 Steps involved in it

Get step-by-step solutions from verified subject matter experts