

Question: 6.6. a. Using Table A.2 in the Appendix, find the values for A2, Dy, and D for samples of size n = 2, n =
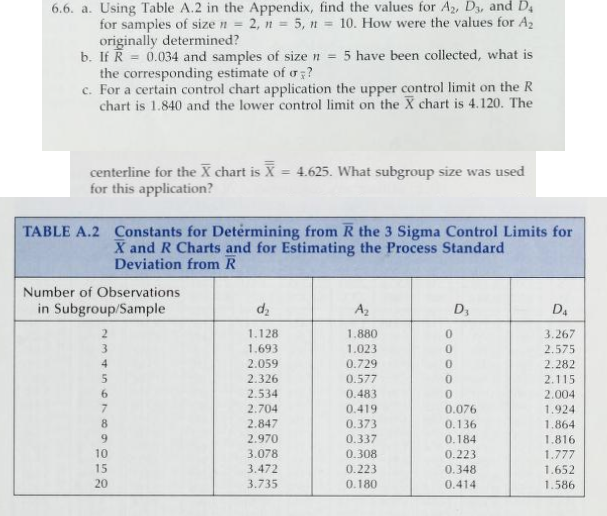
6.6. a. Using Table A.2 in the Appendix, find the values for A2, Dy, and D for samples of size n = 2, n = 5, n = 10. How were the values for A2 originally determined? b. If R = 0.034 and samples of size n = 5 have been collected, what is the corresponding estimate of u ;? c. For a certain control chart application the upper control limit on the R chart is 1.840 and the lower control limit on the X chart is 4.120. The centerline for the X chart is X = 4.625. What subgroup size was used for this application? TABLE A.2 Constants for Determining from R the 3 Sigma Control Limits for X and R Charts and for Estimating the Process Standard Deviation from R Number of Observations in Subgroup/Sample Az D1 DA 1.128 1.880 3.267 1.693 1.023 2.575 2.059 0.729 2.282 2.326 0.577 2.115 2.534 0.483 2.004 2.704 0.419 0.076 1.924 2.847 0.373 0.136 1.864 2.970 0.337 0.184 1.816 3.078 0.308 0.223 1.777 3.472 0.223 0.348 1.652 3.735 0.180 0.414 1.586
Step by Step Solution
There are 3 Steps involved in it

Get step-by-step solutions from verified subject matter experts