

Question: 6.6 Please help with C The data available below give a nation's level of personal disposable income and consumer debt for the past 20 quarters.
 6.6
6.6
Please help with "C"
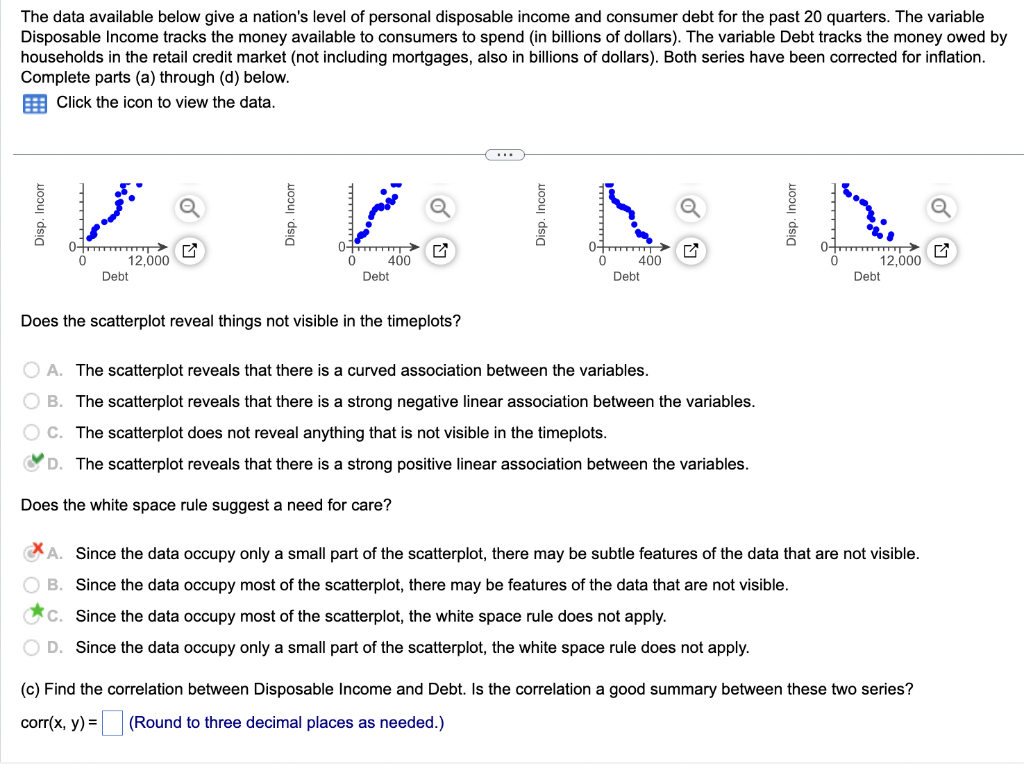
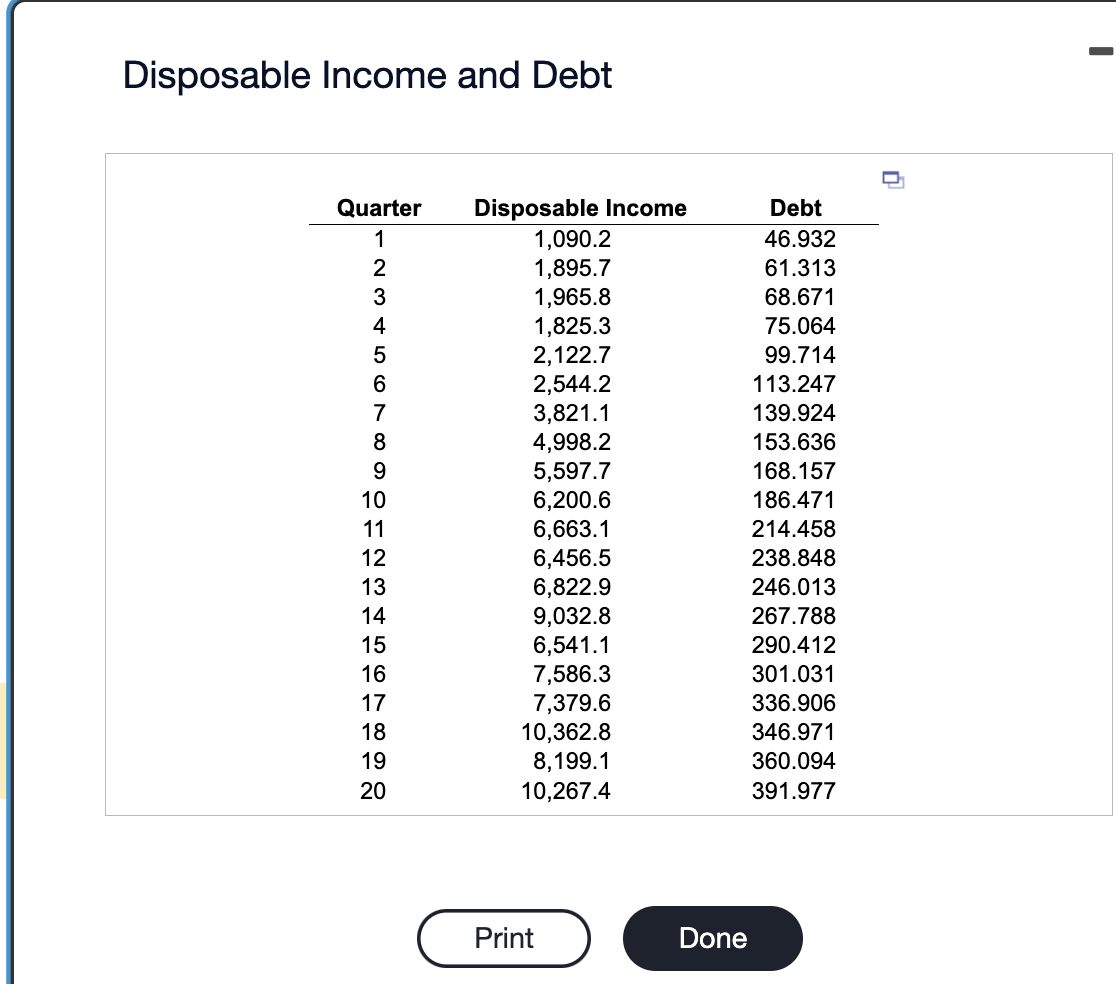
The data available below give a nation's level of personal disposable income and consumer debt for the past 20 quarters. The variable Disposable Income tracks the money available to consumers to spend (in billions of dollars). The variable Debt tracks the money owed by households in the retail credit market (not including mortgages, also in billions of dollars). Both series have been corrected for inflation. Complete parts (a) through (d) below. Click the icon to view the data. Does the scatterplot reveal things not visible in the timeplots? A. The scatterplot reveals that there is a curved association between the variables. B. The scatterplot reveals that there is a strong negative linear association between the variables. C. The scatterplot does not reveal anything that is not visible in the timeplots. D. The scatterplot reveals that there is a strong positive linear association between the variables. Does the white space rule suggest a need for care? A. Since the data occupy only a small part of the scatterplot, there may be subtle features of the data that are not visible. B. Since the data occupy most of the scatterplot, there may be features of the data that are not visible. C. Since the data occupy most of the scatterplot, the white space rule does not apply. D. Since the data occupy only a small part of the scatterplot, the white space rule does not apply. (c) Find the correlation between Disposable Income and Debt. Is the correlation a good summary between these two series? corr(x,y)=( Round to three decimal places as needed. ) Disposable Income and Debt The data available below give a nation's level of personal disposable income and consumer debt for the past 20 quarters. The variable Disposable Income tracks the money available to consumers to spend (in billions of dollars). The variable Debt tracks the money owed by households in the retail credit market (not including mortgages, also in billions of dollars). Both series have been corrected for inflation. Complete parts (a) through (d) below. Click the icon to view the data. Does the scatterplot reveal things not visible in the timeplots? A. The scatterplot reveals that there is a curved association between the variables. B. The scatterplot reveals that there is a strong negative linear association between the variables. C. The scatterplot does not reveal anything that is not visible in the timeplots. D. The scatterplot reveals that there is a strong positive linear association between the variables. Does the white space rule suggest a need for care? A. Since the data occupy only a small part of the scatterplot, there may be subtle features of the data that are not visible. B. Since the data occupy most of the scatterplot, there may be features of the data that are not visible. C. Since the data occupy most of the scatterplot, the white space rule does not apply. D. Since the data occupy only a small part of the scatterplot, the white space rule does not apply. (c) Find the correlation between Disposable Income and Debt. Is the correlation a good summary between these two series? corr(x,y)=( Round to three decimal places as needed. ) Disposable Income and Debt
Step by Step Solution
There are 3 Steps involved in it

Get step-by-step solutions from verified subject matter experts